.avif)


How Do You Find the ROI of a Trade Show: A How-To Guide
On This Page
Most trade show ROI numbers are wrong before the math even starts. Here is how to fix the data, define the right goals, and calculate a number you can actually defend.
Trade show budgets are not small bets. According to industry research, events and trade shows account for roughly 18 to 25% of total B2B marketing spend, making them one of the largest single line items a CMO owns. At that scale, "we think it went well" is not a result. It is a liability. The frustrating part is that most teams believe the ROI problem is a math problem. It is not.

The formula is simple arithmetic. The real failure happens earlier, and it is structural. The formula is straightforward: revenue generated minus total investment, divided by total investment, multiplied by 100. Any spreadsheet handles it in seconds. The problem is not the calculation. The problem is what gets fed into it. A confident-looking percentage built on an incomplete lead count is not ROI. It is a well-formatted guess. This is where the real damage happens. See our digital business card for how this works in practice.
A rep collects a paper card during a hallway conversation. A badge scan sits in a CSV file that nobody exports. A promising demo ends with a handshake and no logged contact. From surveying 4,000 sales reps, Mobilo found that 90% of new contacts never enter the CRM because the manual effort required is simply too high. Those contacts do not show up as lost leads in any report. They show up as silence.
If 60 to 70% of the contacts your team collected never make it into the CRM, your lead count is structurally understated before you run a single calculation. Your cost per lead looks inflated. Your conversion rate looks weak.
Your pipeline looks thin. None of those numbers reflect what actually happened at the show. They reflect what was captured, which is a very different thing. Mobilo Card closes that gap at the point of contact, pushing every tap and scan directly into the CRM. Landsea Homes, for example, eliminated $21,000 per year in print and data-entry costs after adopting Mobilo for event lead capture.
90% of new contacts never enter the CRM
Key takeaways
- Trade show budgets eat 18, 25% of total B2B marketing spend, at that scale, 'we think it went well' is a liability, not a result.
- 90% of new contacts never make it into the CRM after a trade show, which means the revenue number in your ROI formula is already understated before the event ends.
- The standard ROI formula isn't broken, it's being fed broken inputs, turning it into a precise measure of execution failure rather than channel value.
- SMART goals set before the show opens are the measurement contract your team is missing, badge scanning is not a plan.
- Track revenue over a 6-to-12-month window, not 30 to 90 days; B2B sales cycles routinely run a full year, so a quarterly snapshot will structurally miss most of the revenue a show generated.
- Cost per lead is the clearest apples-to-apples metric for comparing a trade show against paid search or outbound, B2B CPL benchmarks range from $420 to $3,080 depending on industry.
- Mobilo Card closes the data gap at the source: one tap syncs a contact's details directly into your CRM in real time, so every conversation from the floor actually enters the pipeline.
Define Your Objectives Before the Show: the SMART Goals Step Everyone Skips
Setting a goal to "get leads and build awareness" before a trade show feels like planning. It is not. The most common failure mode we see among exhibitors is paying for floor space and defaulting to badge scanners and lead capture tools as the plan, with no defined success criteria and no measurement contract in place before the show opens. Without SMART goals locked in before the show opens, you have no measurement contract, only a story you assemble afterward from badge-scan exports and business card piles. The specific, measurable targets you define pre-show are the only thing that separates a credible ROI number from a retrospective guess.
Why SMART Goals Are the Measurement Contract, Not Just a Planning Nicety
A fully loaded trade show investment, booth space, drayage, travel, staff time, lead retrieval devices, produces a precise cost figure. But that number has no meaning without a performance baseline to measure against. Without pre-defined targets tied to specific cost lines, you are doing numerically accurate accounting with no defensible numerator.
The ROI formula becomes incalculable regardless of how carefully you tracked expenses. The accountability gap compounds the problem. When leads are captured on the floor but rely on reps to manually log contacts afterward, data integrity collapses before it ever reaches the CRM.
Mobilocard is built specifically to eliminate that gap. Contacts captured through an NFC tap or QR scan flow directly into your CRM without any manual entry step, so the measurement contract you wrote before the show actually reflects reality when you audit it afterward. This is not a nice-to-have; it is what makes your pre-show targets auditable at all. As the relationship between CRM hygiene and client retention makes clear, a CRM full of manually entered, half-complete records produces the same outcome as no CRM at all.
What a SMART Trade Show Goal Actually Looks Like in Practice
Instead of "get leads at the show," a SMART goal reads: capture 150 qualified leads with full contact data synced to CRM within 24 hours of each interaction, targeting VP-level and above in manufacturing. That goal is specific, measurable, achievable against industry benchmarks, relevant to pipeline targets, and time-bound to the event window. Concrete examples grounded in real objectives:
- Book 20 on-site demos with qualified accounts
- Generate $500K in identified pipeline by close of day three
Each of these requires pre-show definition and an owner, or they will not get measured. When every team member carries a Mobilo card, available on Teams at $4/month per member, billed annually, with unlimited taps and scans, every contact interaction is a timestamped, CRM-ready data point, not a paper card in a jacket pocket. The custom lead capture forms and lead enrichment included in the Teams plan mean the data arriving in your CRM is structured and actionable from the moment of the tap, not after a post-show data-cleaning sprint.
Assign Metric Ownership Before You Ship the Booth, Not After
Every SMART goal needs a named owner before the booth ships. Who tracks demo bookings in real time? Who monitors lead count against the 150 target by end of day two? Without assigned ownership, goals exist on a slide deck and nowhere else.
Key takeaway: 80% of trade show leads receive no follow-up at all. That failure begins at the ownership gap, not the follow-up stage.
80% of trade show leads get zero follow-up
When no one is accountable for a metric on the show floor, the metric does not get captured. The Teams plan's team management dashboard and insights and analytics features give a designated metric owner real-time visibility into lead volume and contact quality across the entire team, so accountability is structural, not dependent on someone remembering to check a spreadsheet at end of day. The central billing and team management controls in the Teams tier also mean the person responsible for ROI reporting can see the full picture without chasing individual reps for their badge-scan exports after the show closes.
What Costs Should Be Included When Calculating Total Trade Show Investment
Trade shows carry a wide range of costs beyond the booth itself, and teams that account for all of them from the start avoid the budget overruns that derail post-show ROI calculations. Understanding the full cost picture, from booth rental through post-show follow-up, is the foundation of any accurate ROI calculation.
1. Exhibit Space Rental Fees - The Largest Fixed Cost You Cannot Ignore
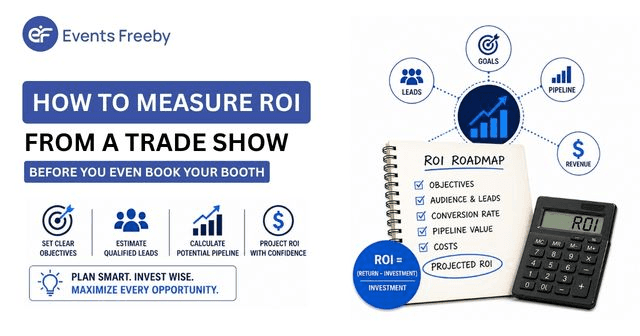
Floor space rental is typically the single biggest line item in any trade show budget, often consuming 25–35% of total spend. Costs vary dramatically by show prestige, location, and booth size, a 10x10 inline at a regional show may run $2,000 while a 20x20 island at a major industry expo can exceed $20,000. Marketers calculating ROI must anchor their denominator here first, as underestimating this cost skews every downstream metric.
2. Booth Design and Fabrication - Amortized Capital Expense Across Multiple Shows
Custom booth design and fabrication ranges from $5,000 for modular pop-up displays to well over $150,000 for large custom builds with integrated technology and lighting. The critical ROI consideration is amortization, a $60,000 booth used across six shows costs $10,000 per event, not $60,000. Teams that fail to spread this capital cost across its useful life consistently overstate per-show investment and undervalue their actual return.
3. Freight, Drayage, and Material Handling - The Hidden Cost That Shocks First-Timers

Freight shipping and drayage, the fee charged by convention centers to move materials from the loading dock to your booth, routinely surprises exhibitors with bills that rival booth rental itself. Drayage is billed per hundredweight (CWT) and can add $3,000–$15,000 depending on exhibit weight and show venue. Any accurate ROI calculation must include inbound and outbound freight, drayage, and material handling fees as non-negotiable line items.
4. Staffing and Travel Expenses - The People Cost That Compounds Quickly
Staff costs encompass salaries or agency fees, flights, hotel rooms, meals, and per diems for every team member on the show floor. Sending four employees to a three-day show in a major city can easily add $8,000–$15,000 in travel and lodging alone before accounting for lost productivity. Marketers calculating total investment must include fully-loaded staff costs, not just registration or booth fees, to avoid a falsely optimistic ROI figure.
5. Show Services and On-Site Utilities - Electrical, Wi-Fi, and Installation Labor
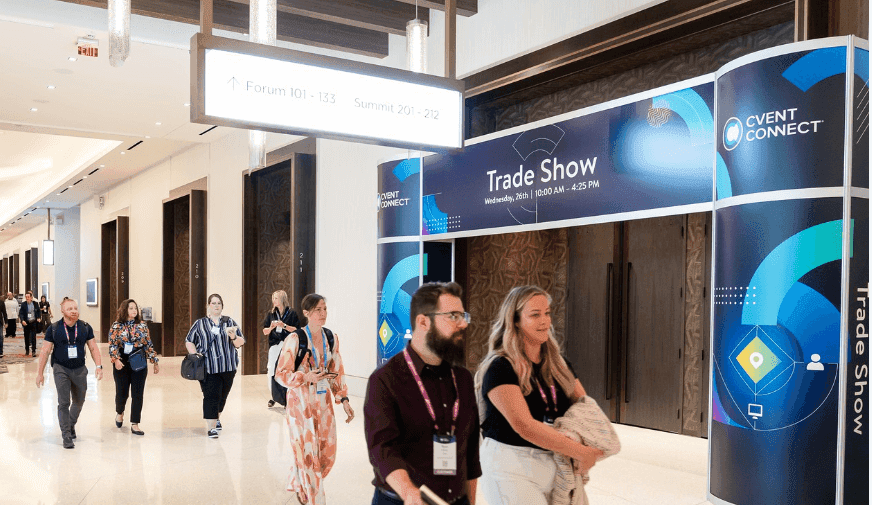
Convention center show services, including electrical hookups, internet connectivity, rigging, cleaning, and union installation labor, are billed separately from booth rental and frequently catch exhibitors off guard. A single 20-amp electrical drop can cost $400–$800, and union labor rates for booth setup often run $150–$250 per hour with mandatory minimums. These costs must be itemized in the total investment figure to produce an honest ROI calculation.
6. Pre-Show Marketing and Promotional Giveaways - Demand Generation Spend That Belongs in the Denominator

Pre-show email campaigns, social media ads, appointment-setting outreach, and branded giveaway items are direct costs of generating the leads the show is meant to produce. Excluding them from total investment inflates apparent ROI by attributing revenue to a smaller cost base. Giveaway budgets alone can range from $500 to $10,000+ depending on quantity and item quality, and pre-show digital spend adds further. Including these costs ensures ROI reflects the true cost of every lead captured.
What Is the Basic Formula for Calculating Trade Show ROI
That honest denominator is only half the equation. The numerator demands the same discipline, and that is where most ROI calculations quietly collapse, not because the formula is wrong but because the numbers fed into it are. The standard formula is not broken; it is being fed broken inputs, making it a precise measure of execution failure rather than channel value.
One pattern we see repeatedly among field marketing teams: companies report near-zero trade show ROI over multiple years despite spending roughly $18,000 per event cycle, yet the formula itself is never the culprit. The real culprit is that the cost side is understated. Hidden expenses like union labor, drayage, and freight routinely inflate the true cost-per-event well beyond the booth fee, while the revenue side is understated even further, because captured leads and attributed revenue reflect only the fraction of interactions that survived an analog data-capture process.

Key takeaway: Because 81% of attendees carry buying authority yet that same reality goes unaccounted for in the revenue side of the equation, the formula reliably outputs weak ROI numbers not because the channel underperforms but because the inputs on both sides of the fraction are quietly broken before anyone opens a spreadsheet.
Two Versions of the Trade Show ROI Formula
"Companies report near-zero trade show ROI over multiple years despite significant spend (~$18k per cycle), making it difficult to justify the basic ROI formula inputs (revenue generated vs. total cost)." The standard formula is not broken; it is being fed broken inputs, making it a precise measure of execution failure rather than channel value.
Trade show ROI is calculated two ways, and both produce the same result. Use the version that fits where your numbers are coming from:
When you are building the number yourself from CRM data and cost sheets, the more common scenario for field marketing teams working post-show attribution
Either way, a $40K investment that generates $120K in revenue produces $80K net profit and a 200% ROI. A critical discipline on the denominator: total investment must include the full cost stack, not just the booth rental. Union labor, drayage, freight, and logistics are real line items that teams routinely omit, which inflates apparent ROI and makes show-to-show comparison meaningless. If your denominator is wrong, your 200% becomes 140%, and you have no idea why a channel that "should" work keeps disappointing.
Worked Example: $40K Investment, 200% ROI, and Where It Breaks
Walk through a realistic scenario. Your team spends $40K total at a show, booth, staffing, travel, union labor, freight, and logistics included. Within nine months, closed deals from show leads total $80K. Your pipeline holds $200K in qualified opportunities. Applying a 30% close rate, consistent with average B2B trade show lead-to-close conversion benchmarks we observe across field marketing programs, yields $60K in estimated pipeline revenue. Total revenue basis: $140K.
ROI: ($140K minus $40K) / $40K = 250%. That is a strong result. The problem is that each of those inputs depends entirely on how many leads were captured in the first place, and how cleanly they moved into your CRM.
This is where total visitor count becomes a trap. Foot traffic is the metric most teams fall back on when lead capture fails, but counting bodies through a booth tells you nothing about buying authority, follow-up status, or pipeline contribution. It is the trade show equivalent of measuring website sessions instead of conversions: it fills a cell in the report without informing a single decision.
The structural fix is removing the manual logging step entirely. Mobilocard captures leads from events and field meetings directly into the CRM without relying on reps to manually log contacts, which means the lead count that feeds your ROI numerator reflects actual interactions, not the subset a rep remembered to enter at the hotel bar the night after the show. On the Teams plan ($4/month per member, billed annually), that means full team data analytics, CRM integrations, lead enrichment, and control over data fields across every rep on the floor simultaneously.
On the Business plan ($5/month per member, billed annually), you add enterprise SSO, HR directory sync, and custom lead capture forms, so the data flowing into your ROI calculation is complete, structured, and attributed before the flight home.
Why Pipeline Value Belongs in the Numerator and How to Discount It Honestly
Including open pipeline in the numerator is correct. B2B sales cycles routinely run six to twelve months, so excluding in-progress deals systematically understates the channel's contribution. The discipline is in the discount rate, and that discipline depends entirely on the quality of the lead data underneath it: if your pipeline is populated with contacts captured by a rep who manually transcribed a paper card three days after the show, your confidence interval on that 30% close rate should be wide enough to drive a freight truck through.
How Do You Measure Revenue and Returns From a Trade Show - Including the Long Tail
Track revenue over a 6-to-12-month window after the event, not 30 to 90 days. B2B sales cycles routinely run 12 months or longer, according to research from HeySid, which means a quarterly ROI snapshot will structurally miss the majority of revenue a show actually generated. The number looks thin not because the show underperformed, but because most of the pipeline is still moving.
Key takeaway: The core problem most organizations face is not a flawed ROI formula, it is a measurement window that closes before the majority of show-sourced revenue has had time to appear.
Why the Measurement Window Matters
The familiar approach is to pull closed-won deals at the end of the quarter, divide by event costs, and call it done. The hidden cost: a deal that closes in month eight from a contact met at a February show never gets counted. That $90K contract simply disappears from the attribution report, and the show gets cut from next year's budget. This structural undercounting can exceed 50% of actual show-sourced revenue when teams rely on a 90-day window alone.
1. Track Closed-Won Revenue Directly Attributed to Show Contacts in Your CRM
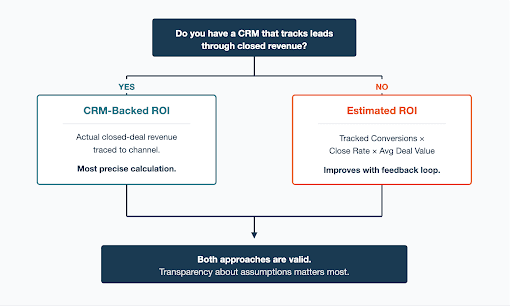
The most defensible trade show ROI calculation starts with tagging every contact and deal originated at the event inside your CRM, then filtering closed-won revenue by that campaign source. This approach works best for B2B teams with deal cycles under six months. The core tradeoff: it undercounts value by ignoring influenced pipeline where the show accelerated but didn't originate the opportunity.
2. Apply Multi-Touch Attribution to Capture Show-Influenced Pipeline, Not Just Sourced Deals
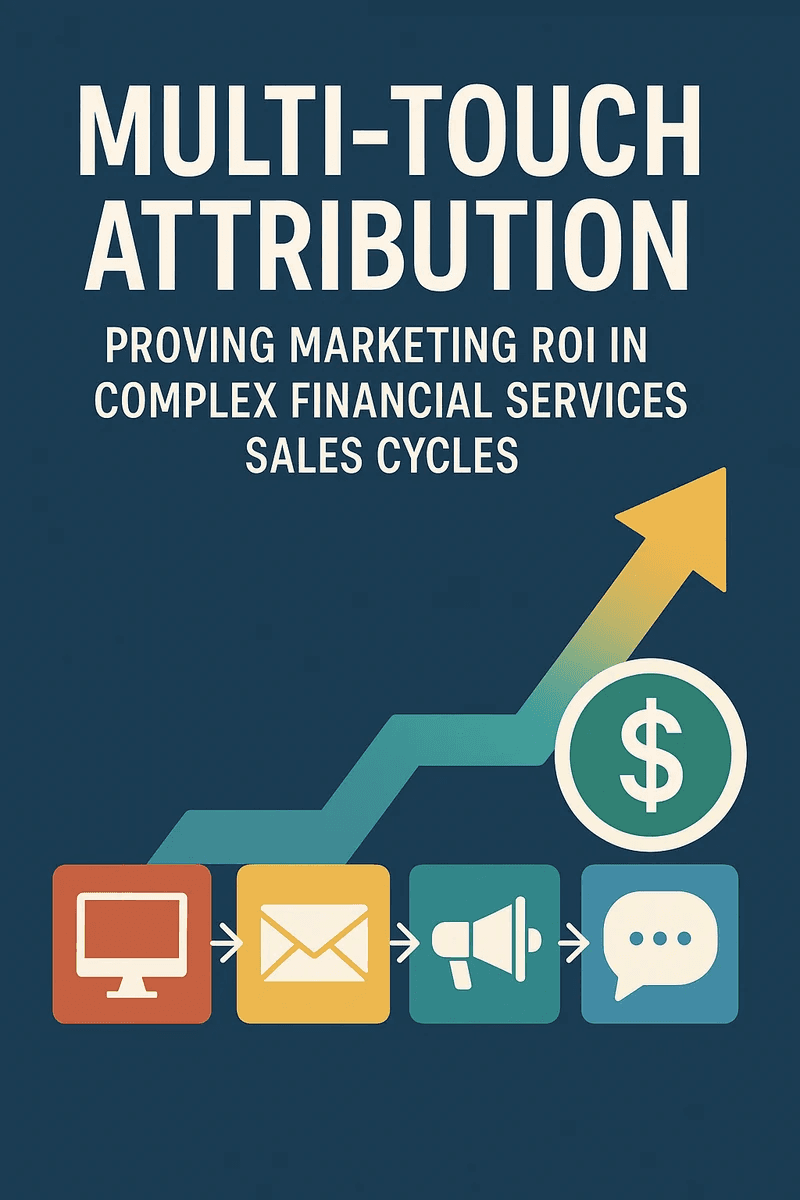
Multi-touch attribution models, linear, U-shaped, or time-decay, distribute revenue credit across every touchpoint, including the trade show booth scan, post-show email, and eventual demo. This is the right method for enterprise B2B teams with long, multi-stakeholder sales cycles where first- or last-touch models systematically undervalue event investment. The tradeoff is model complexity and the organizational buy-in required to agree on credit weights.
3. Measure the Long-Tail Pipeline Window at 6, 9, and 12 Months Post-Show
Trade show ROI is routinely underreported because most teams close the measurement window at 90 days. Setting explicit pipeline snapshots at six, nine, and twelve months post-event captures deals that incubated slowly from booth conversations. This matters most for high-ACV products with long procurement cycles. The limitation is that attribution confidence erodes over time as contacts accumulate additional touchpoints that dilute the show's causal role.
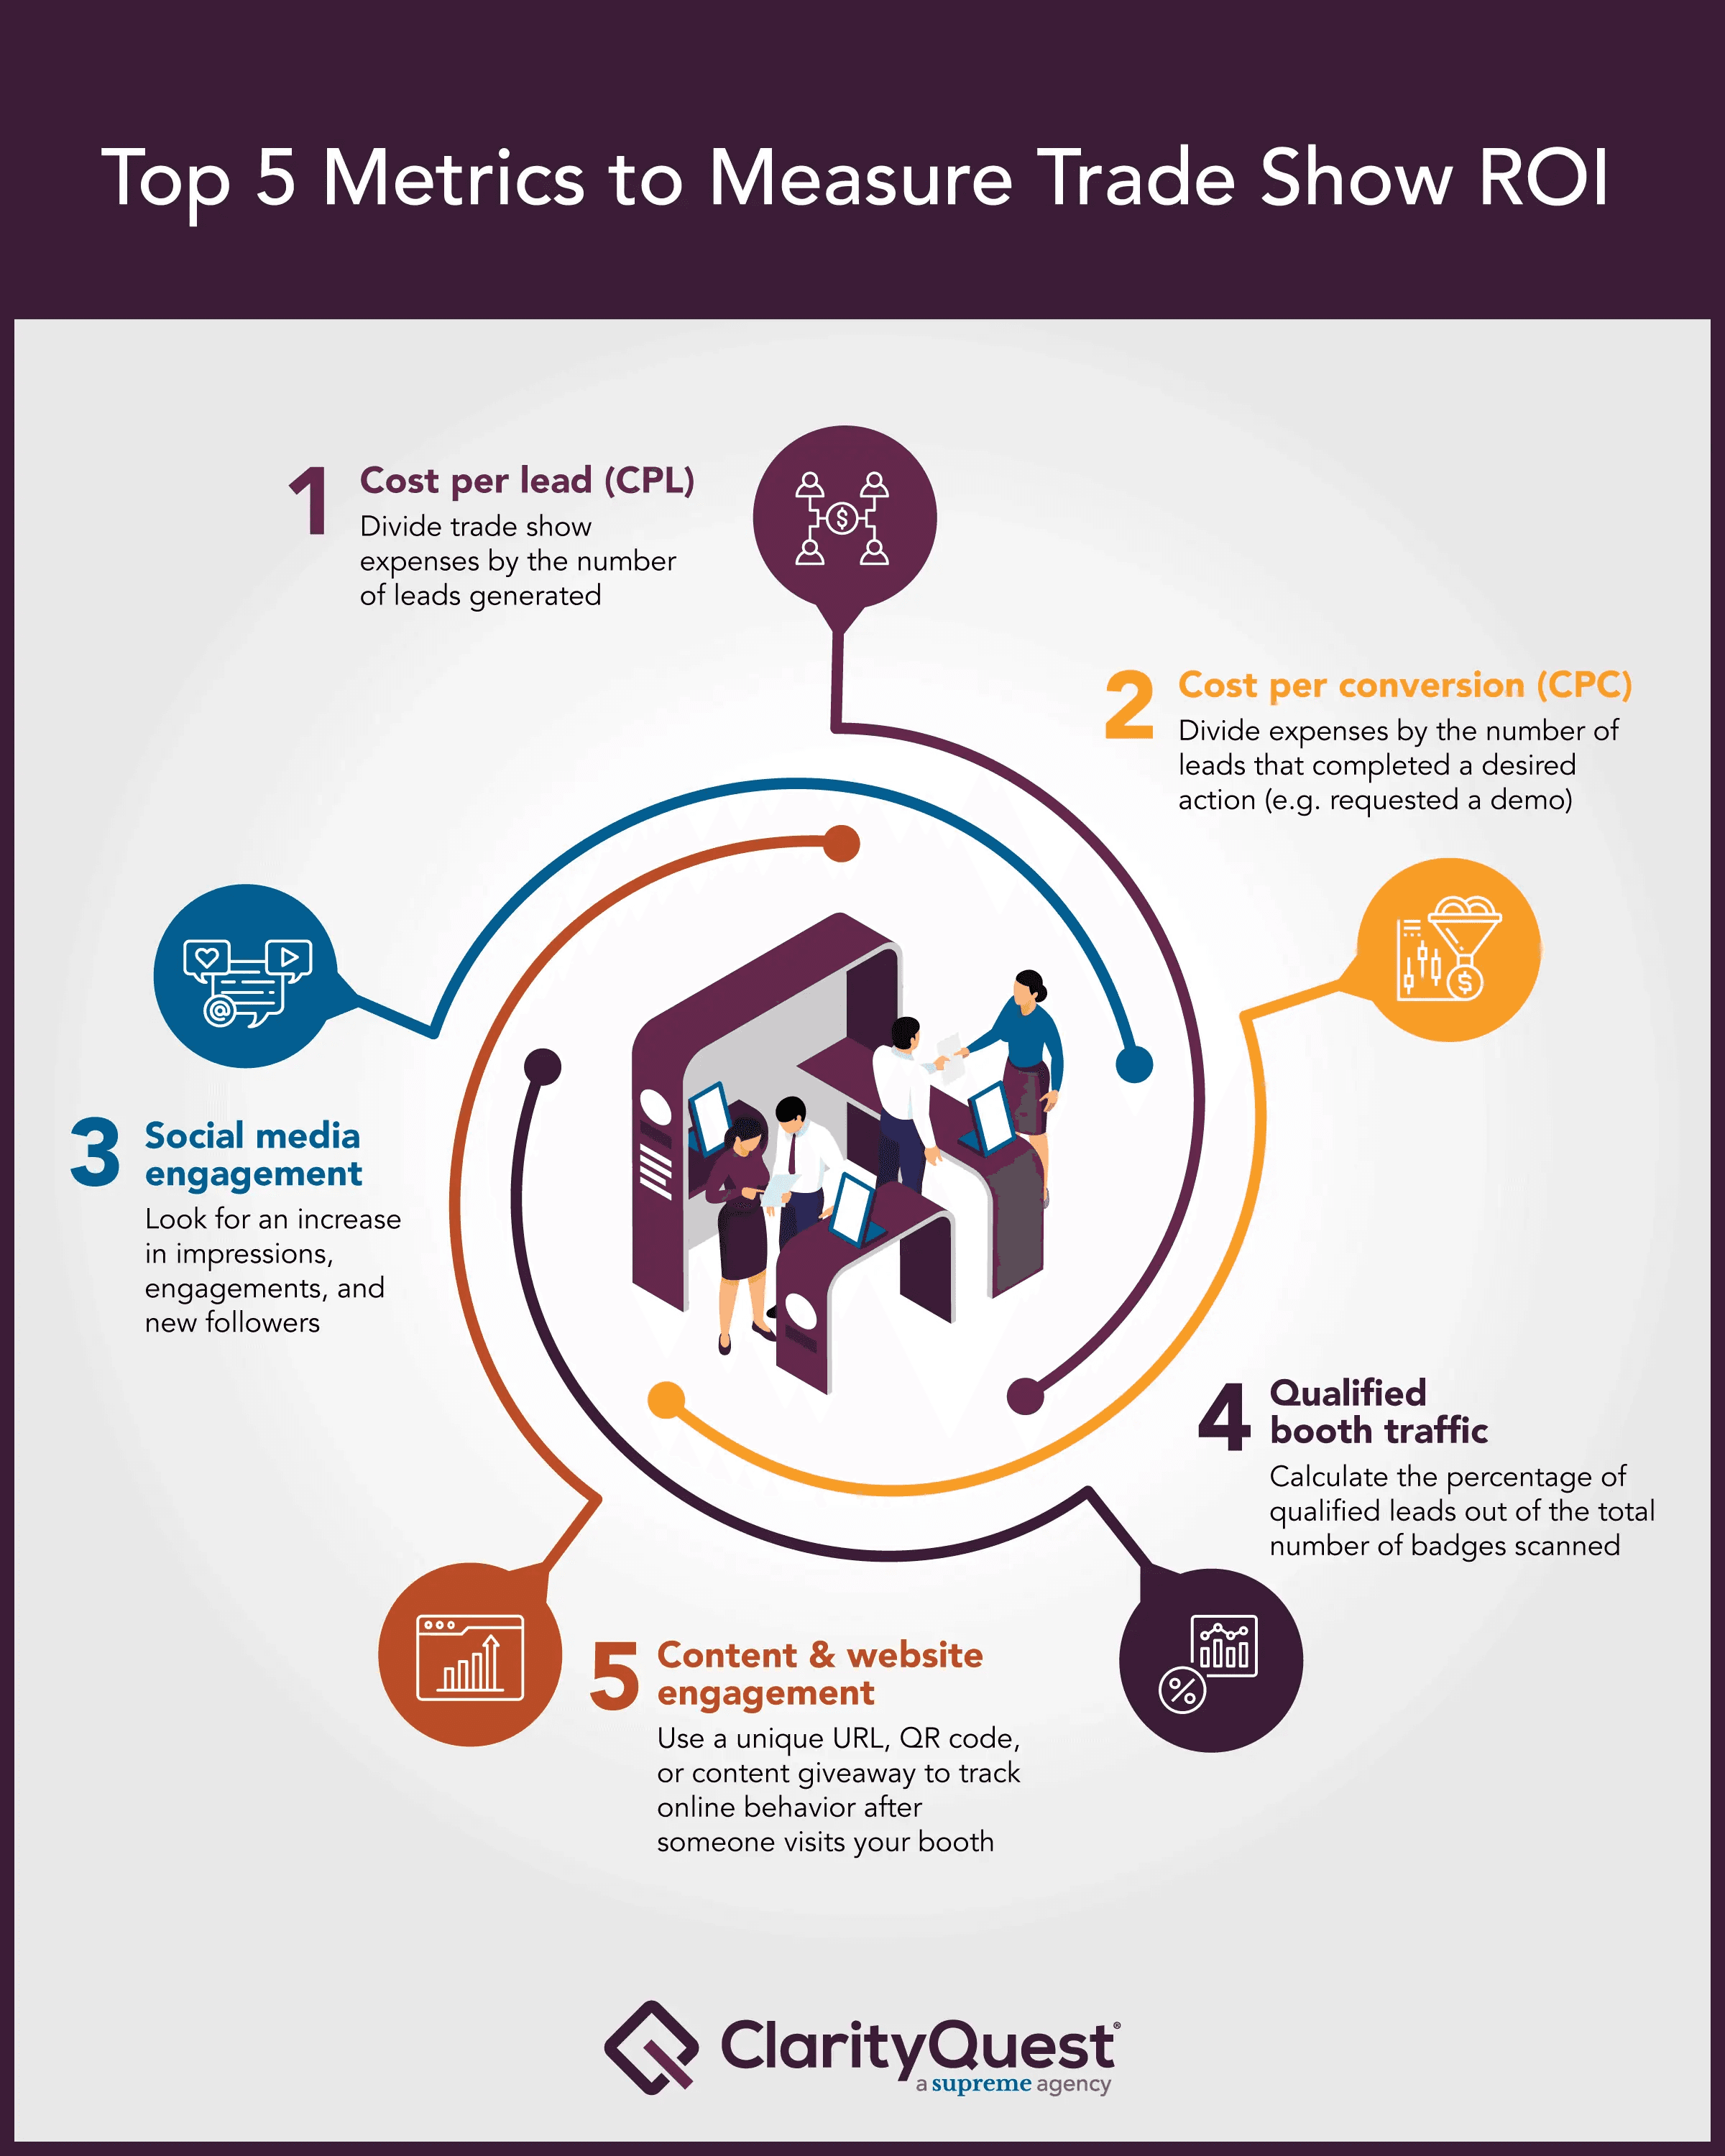
4. Calculate Cost-Per-Qualified-Lead and Cost-Per-Opportunity to Benchmark Show Efficiency
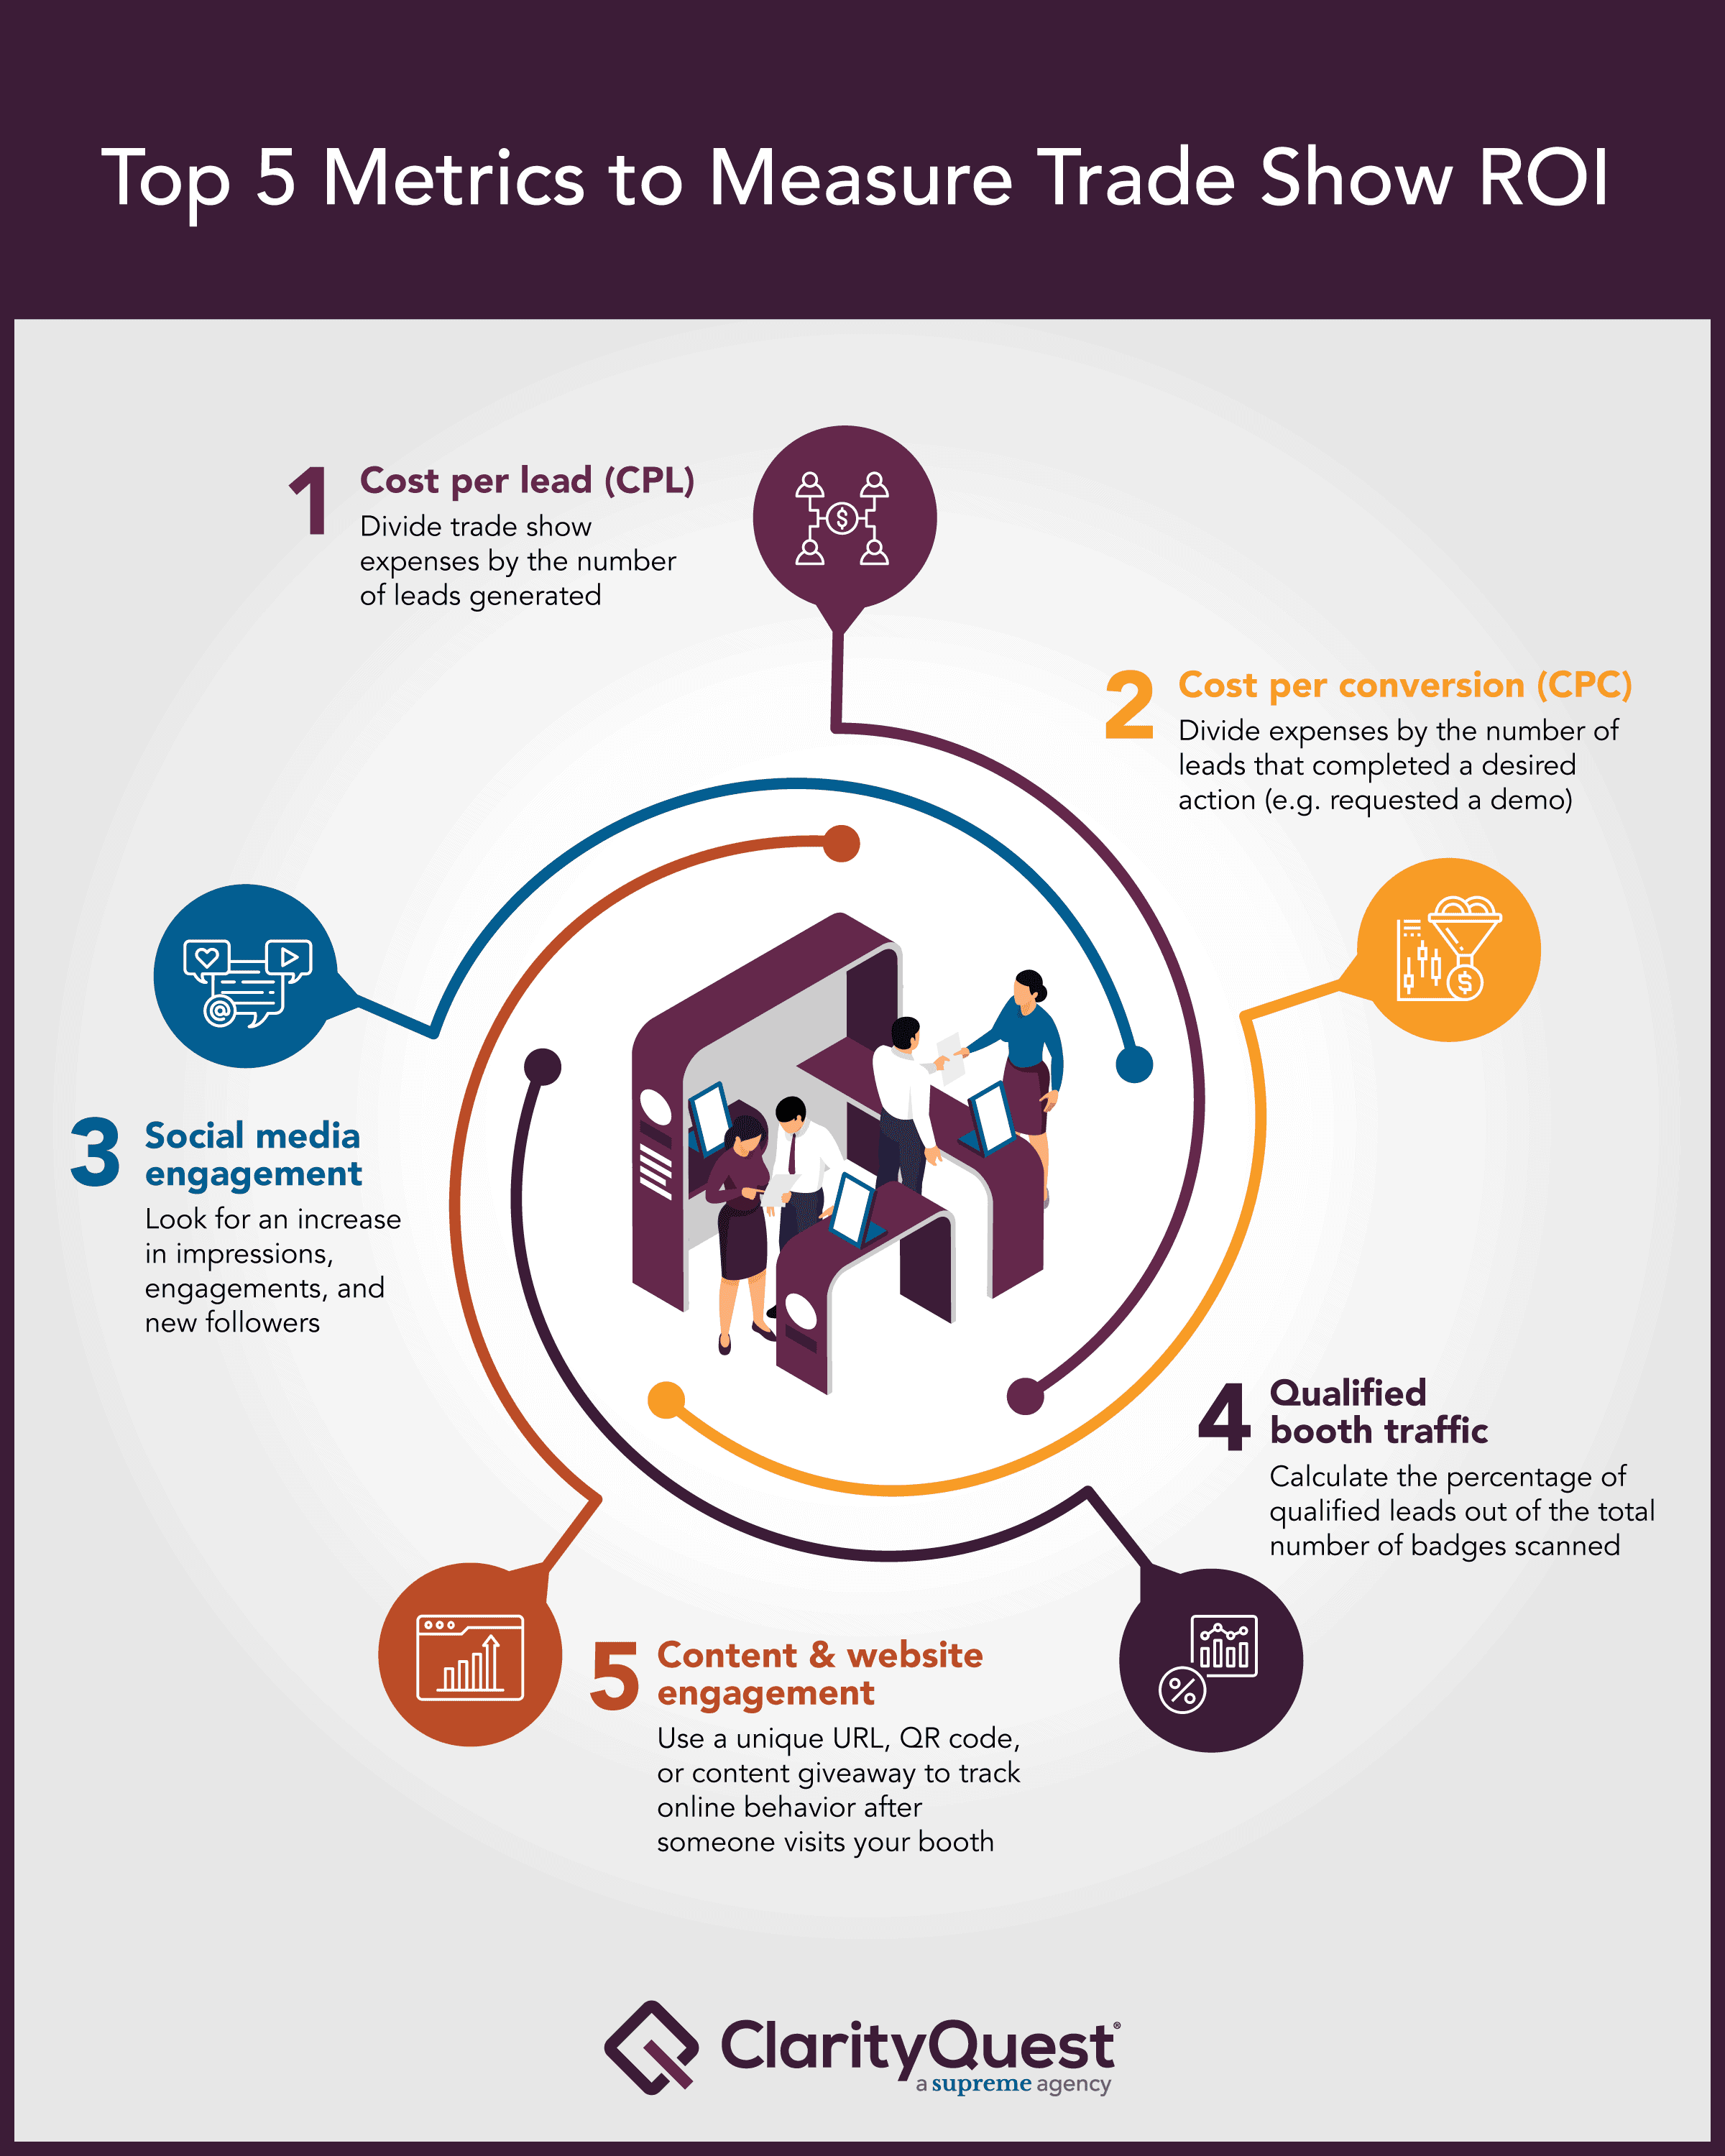
Dividing total show spend, booth, travel, sponsorship, staff time, by the number of sales-qualified leads and by opportunities created gives a normalized efficiency metric comparable across events and channels. Revenue teams use this to decide which shows to repeat, scale, or cut. The key limitation is that lead quality scoring must be consistent pre- and post-show; inconsistent qualification criteria make the benchmark meaningless across years or events.
5. Run Structured Post-Show Lead Nurture Sequences to Accelerate and Measure Pipeline Conversion
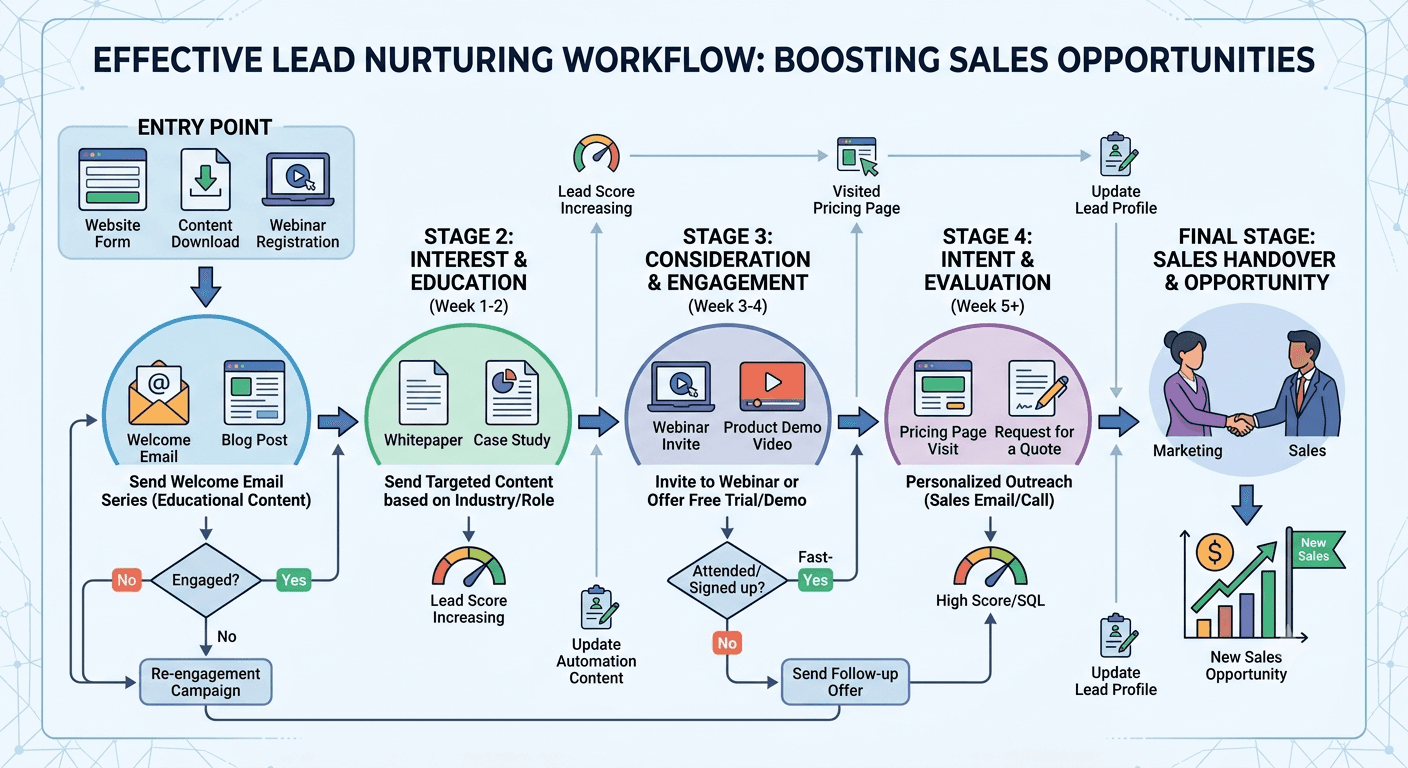
A sequenced post-show nurture program, segmented by lead tier and triggered within 48 hours, both accelerates pipeline conversion and creates a measurable funnel stage that isolates show-sourced contacts. Tracking open-to-meeting and meeting-to-opportunity rates within this sequence gives revenue ops a clean conversion benchmark tied to the event. The tradeoff is that without tight CRM hygiene and list segmentation, show leads blend into general nurture and attribution breaks down entirely.
Related Reading
- Etiquette For Networking In Online Conferences
- Measuring Event Roi
- Trade Show Sales Tips
- Trade Show Sales Funnel
- What Is Trade Show Marketing
- Trade Show Follow Up Best Practices
- Event Lead Management
- B2b Trade Show Best Practices
- Conference Lead Generation
- B2b Trade Show Marketing
- Trade Show Lead Follow Up
Key Trade Show ROI Metrics to Track Beyond the Basic Percentage
Most teams treat the basic ROI percentage as the finish line, but cost per lead is where the real diagnostic work happens because it lets you compare a trade show directly against every other channel you run. The problem is that trade show CPL is routinely distorted before the math even starts, not by overspending, but by undercounting leads at the booth. The metrics below show where the number breaks down and how fixing the capture layer changes the calculation without touching your budget.
1. Cost Per Lead (CPL): The Efficiency Benchmark Every Exhibitor Needs
When asking how do you find the ROI of a trade show, CPL cuts through vanity metrics by dividing total show spend by qualified leads captured. It's the right metric for budget-conscious marketing teams comparing trade shows against digital channels. The real tradeoff: CPL ignores lead quality, so a low CPL from unqualified badge scans can mislead teams into overvaluing a show that never converts.
2. Lead-to-Opportunity Conversion Rate - Where Pipeline Reality Gets Revealed
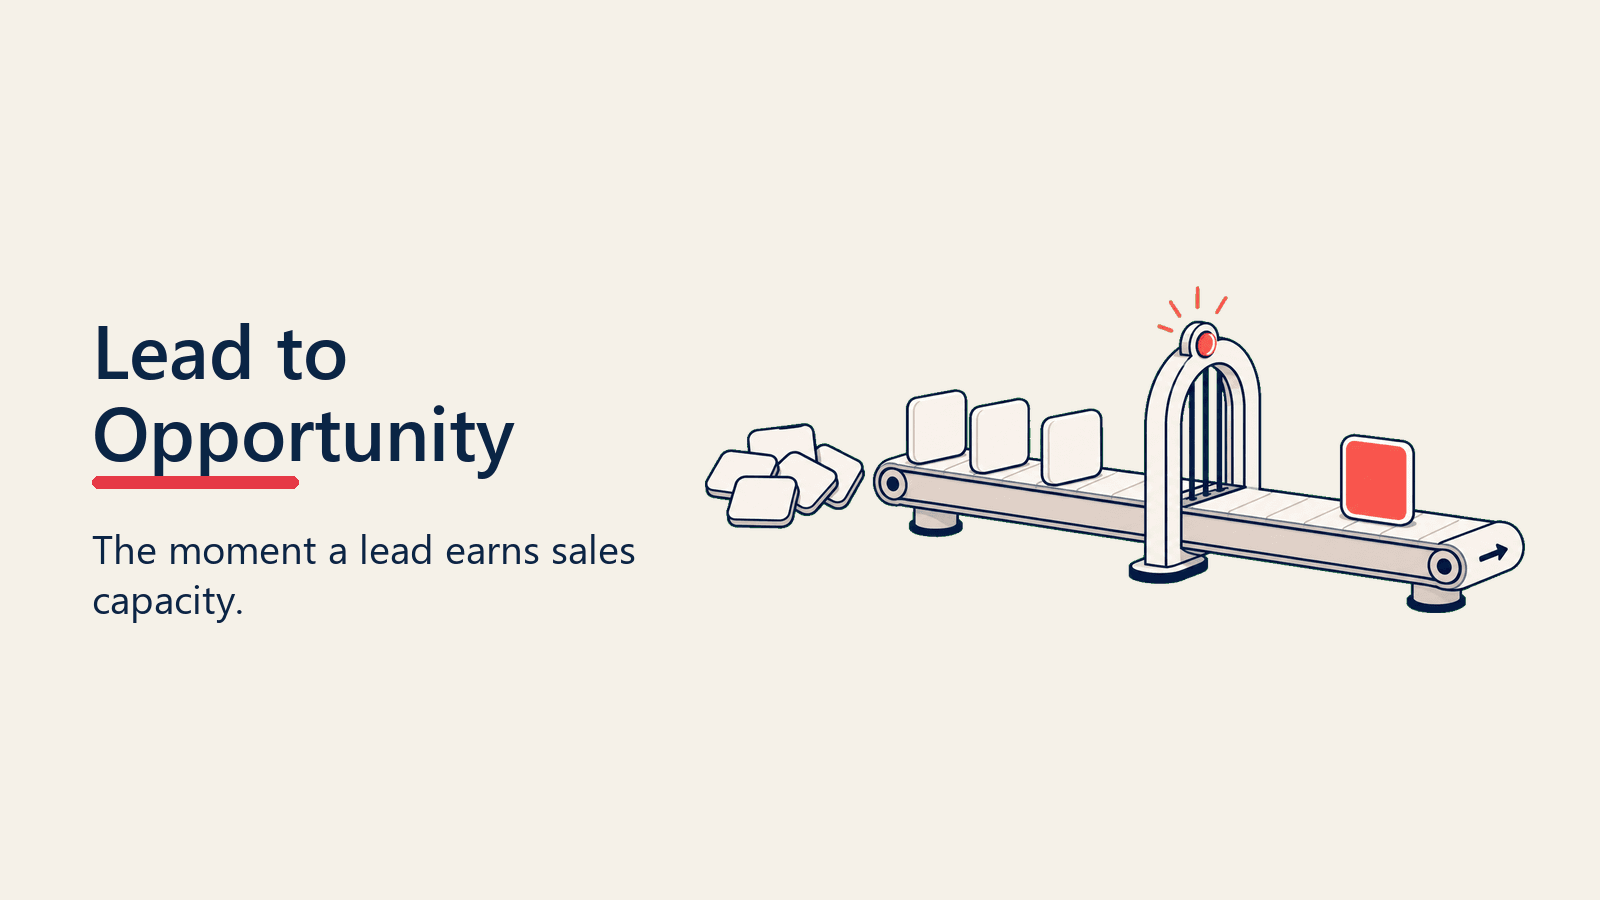
The lead-to-opportunity conversion rate measures the percentage of captured contacts that advance into active sales opportunities. This metric tells you whether the show attracted your ideal customer profile or just curious foot traffic. Track this rate per show and per rep so you can spot whether a low conversion rate reflects a targeting problem, a follow-up timing problem, or a data quality problem inherited from incomplete capture.
Data quality is where teams running analog capture consistently fall short. A badge scan or a handwritten card introduces transcription errors and missing fields before the contact ever reaches a rep. Mobilocard's lead enrichment feature, included on the Pro ($3/month), Teams ($4/month), and Business ($5/month) plans, and the paper business card scanner reduce that gap by capturing structured data at the point of contact. Richer, cleaner data at intake means conversion rate comparisons across shows reflect actual pipeline quality, not noise introduced by a broken capture process.
3. Booth Engagement Rate - Measuring Attention Quality, Not Just Foot Traffic
Booth engagement rate compares meaningful interactions, demos completed, conversations exceeding two minutes, product trials initiated, against total booth visitors. It's the right metric for exhibitors investing in large, high-traffic spaces who need to justify premium floor positions. The tradeoff is measurement complexity: tracking meaningful engagement requires trained staff or technology like badge scanners, which adds operational overhead most small teams underestimate.
4. Post-Show Follow-Up Response Rate - The Metric That Exposes Sales Execution Gaps
What most teams report is that a significant share of trade show leads never receive a follow-up call or email from sales. That failure does not just lose deals; it corrupts your conversion rate metric by leaving warm contacts stranded outside the pipeline. Response rate measures the percentage of captured leads that received outbound contact within a defined window, typically 48 to 72 hours. If your response rate is low, your conversion rate is understated and your CPL is overstated. Both numbers lie in the same direction. Speed is a function of routing.
When a contact captured at an event lands automatically in the CRM, without a manual logging step, the follow-up clock starts the moment the tap or scan happens, not the morning a rep finally processes a stack of paper cards. The Teams and Business plans both include team management, central billing, and insights and analytics, so managers can see which reps have responded and which contacts are aging past the 48-to-72-hour window before the opportunity cools.
5. Brand Lift Score - Quantifying Awareness Gains Beyond the Lead Count
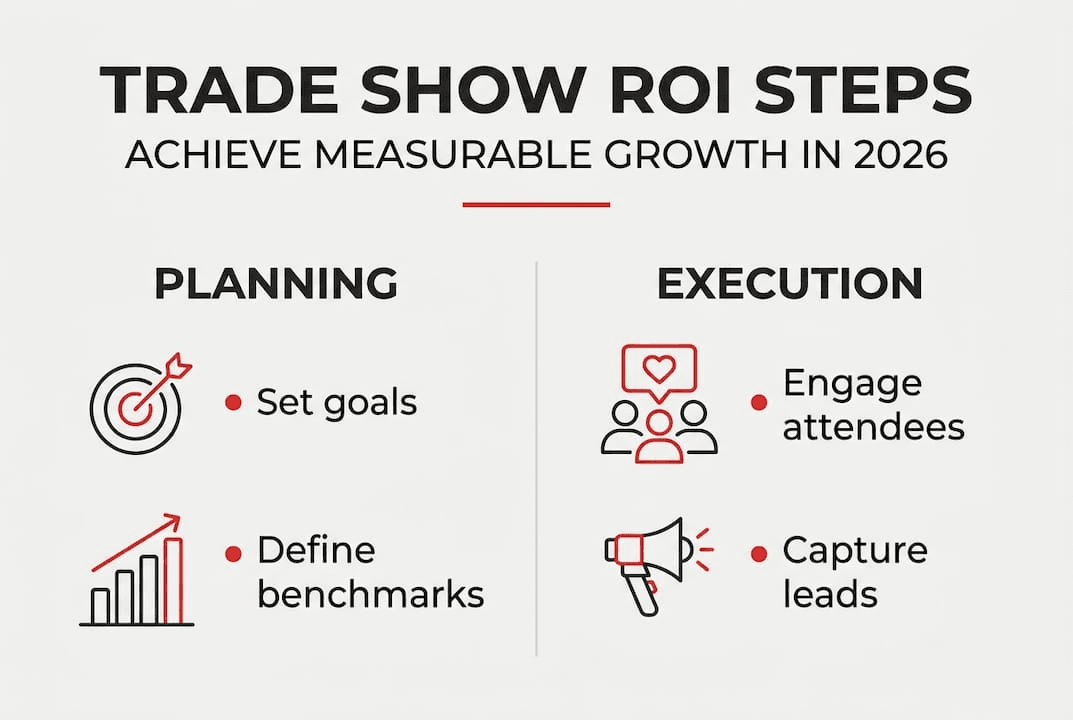
Brand lift measures the increase in aided awareness, purchase intent, or brand favorability among your target audience attributable to trade show presence. It's the right metric for companies exhibiting at industry flagship events where relationship-building and category authority matter as much as immediate lead generation. The tradeoff is cost and complexity, capturing brand lift requires pre- and post-show surveys of a control group, which most mid-market exhibitors skip entirely.
6. Customer Acquisition Cost (CAC) From Show - The Long-Horizon ROI Anchor
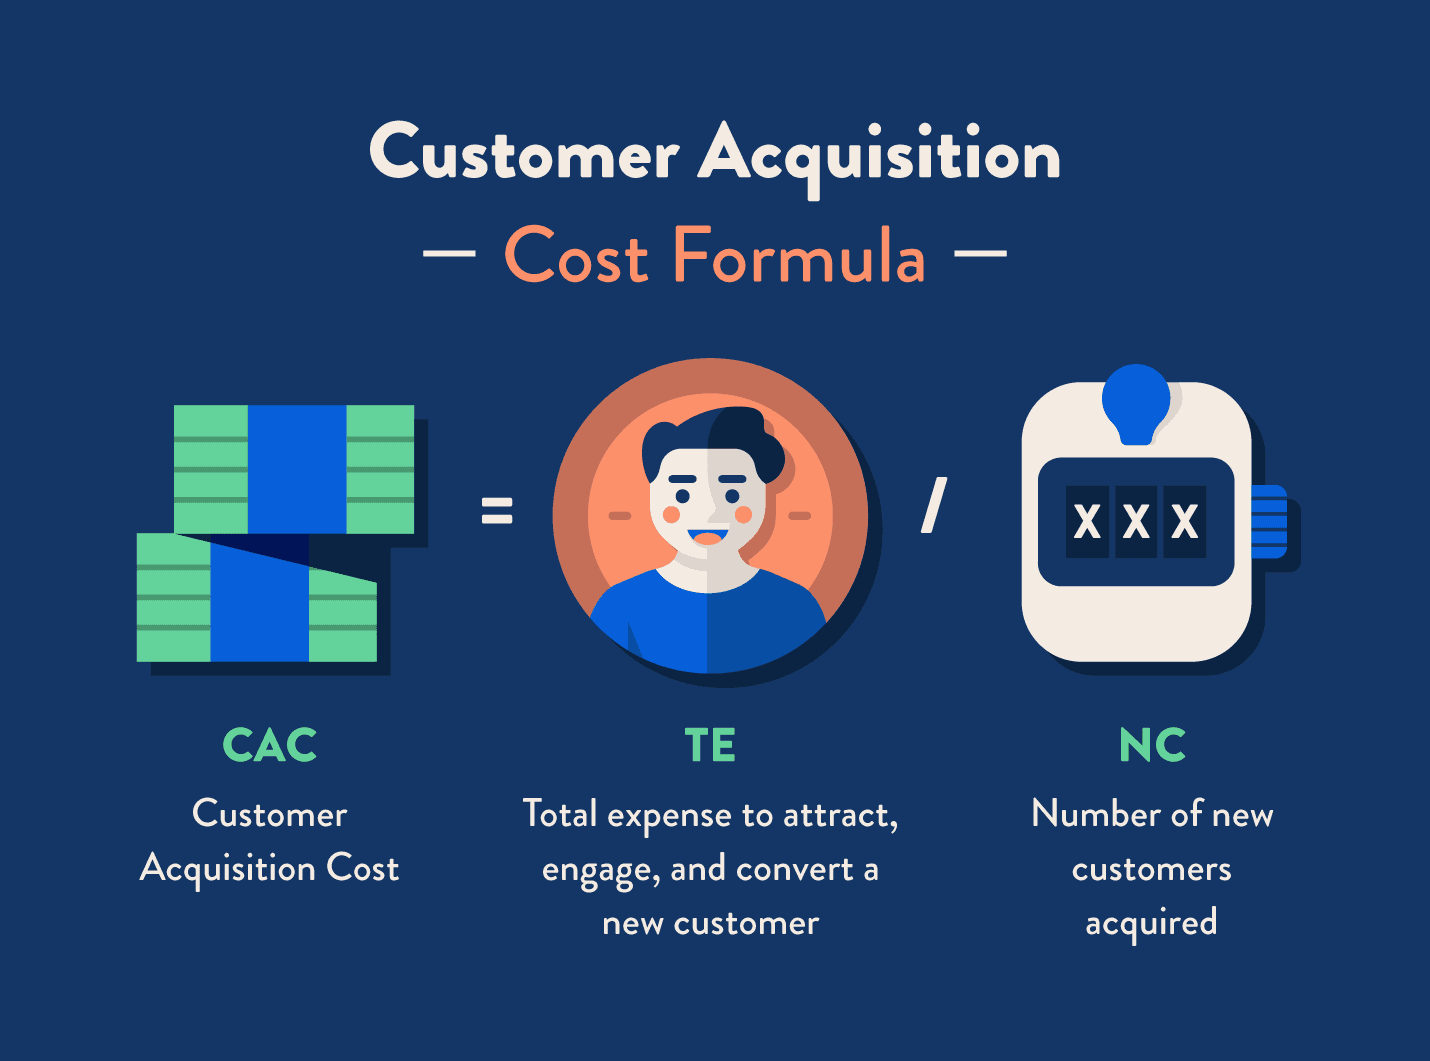
CAC from show divides total event expenditure by the number of net-new customers closed who were first contacted at that event, giving the truest answer to how do you find the ROI of a trade show over a full sales cycle. It's indispensable for annual budget justification and show-versus-show comparisons. The critical limitation is time: calculating accurate CAC requires waiting out the full sales cycle, often six to eighteen months, making it a lagging indicator unsuitable for real-time optimization.
Strategies to Maximize Trade Show ROI by Closing the Lead-Capture Data Gap
The vast majority of new contacts never make it into the CRM after a trade show. That is not a follow-up discipline problem. It is a structural data problem, and it means the revenue numerator in your ROI formula is quietly understated before your team boards the flight home.
The failure point is usually the capture moment itself. Badge scanners export a thin slice of contact data: name, company, email, and little else. Notes about conversation context, product interest, or buying timeline stay locked in a rep's memory or on a paper card that never gets scanned.
Contact accuracy begins degrading within 24 to 48 hours of the event as context fades and cards pile up. By the time manual batch uploads reach the CRM, the optimal follow-up window has already closed. Research published by LinkedIn event professionals points to the very same conclusion. The strategies below close that gap directly.
1. Deploy a Standardized Lead Qualification Framework at the Booth
Without a consistent qualification framework, booth staff capture wildly inconsistent data, some leads get budget and timeline noted, others just a name. Event marketing teams at mid-market B2B companies benefit most from a pre-defined scoring rubric (BANT or similar) applied at point of capture. The tradeoff: rigid frameworks can slow down high-traffic booth moments, so staff need rehearsal to apply them fluidly.
2. Replace Badge Scanning with a Multi-Field Digital Lead Capture App
Image: How Do You Find the ROI of a Trade Show - replace badge scanning multi
Organizer-provided badge scanners typically export only name and email, leaving intent signals, product interest, and conversation notes uncaptured. Switching to a purpose-built lead capture app lets teams append custom fields, voice notes, and qualification tags in real time. The key limitation is app fragmentation, if different team members use different tools, data normalization before CRM import becomes a significant post-show burden.
3. Eliminate Business Card Collection as a Primary Lead Method
Business cards remain the single largest source of lead-capture data loss at trade shows, cards get lost, handwriting is illegible, and manual re-entry introduces errors that corrupt CRM records. For revenue operations teams trying to calculate how do you find the ROI of a trade show, untracked card leads are invisible pipeline. The tradeoff is that some senior prospects still prefer card exchanges, so a hybrid digital-backup protocol is necessary.
4. Implement Real-Time CRM Sync to Prevent Post-Show Data Decay

Lead data captured at a show degrades rapidly, context fades, contacts change roles, and follow-up windows close within 48–72 hours. Teams that sync lead records directly into their CRM during the event, rather than batch-uploading afterward, preserve conversation context and enable same-day sales outreach. The real tradeoff is Wi-Fi reliability on the show floor; offline-capable sync tools with automatic upload queuing are essential.
5. Establish a 24-Hour Follow-Up SLA to Protect Measurable Pipeline Attribution
The ability to calculate trade show ROI depends entirely on connecting captured leads to downstream pipeline, and that connection breaks when follow-up is delayed beyond the prospect's memory of the interaction. A 24-hour follow-up SLA, enforced through automated CRM task creation at point of lead capture, keeps attribution intact and conversion rates measurable. The limitation is sales team bandwidth immediately post-show, making pre-built personalized email sequences a prerequisite.
Related Reading
- Which Networking Software Is Best For Conferences
- Trade Show Booth Ideas To Attract Visitors
- Conference Lead Capture
- How To Measure Trade Show Effectiveness
- Virtual Event Success Metrics
- Trade Show Roi
- Trade Show Lead Generation Ideas
- What's The Best Event Lead Generation Software
- Post-Trade Show Marketing Strategies
- Best Trade Show Giveaways
Next steps
If your post-show numbers keep looking weak no matter how carefully you track costs, the path forward starts with recognizing that the revenue numerator is broken before the formula runs. Ninety percent of new contacts never reach the CRM, which means your lead count is structurally understated from the moment the show closes. Start with our digital business card.
The CPL comparison problem makes this concrete: trade show cost-per-lead looks artificially high not because the channel is inefficient, but because analog capture failures shrink the denominator while digital channels count every form fill automatically. Fixing the capture layer alone, without changing a single dollar of show investment, may bring trade show CPL inside the benchmark range most teams assume it violates. That finding connects directly to the 80% follow-up failure rate, which is not a sales discipline problem but a data-capture infrastructure problem: contacts that arrive in the CRM days late via manual entry land after the optimal follow-up window has already closed.
Together, they point to one corrective action, which is replacing the manual logging step with a capture method that writes to the CRM at the moment of contact. Start with a digital business card that pushes every tap and scan directly into your CRM pipeline, so the lead count feeding your next ROI calculation reflects what actually happened on the show floor.
Related Reading
- Best Tech Conferences For Networking
- Best Networking Apps for Trade Show Attendees
- Best Finance Conferences For Networking
- Trade Show Booth Ideas For Small Budgets
- Virtual Conference Booth Ideas
- Networking Activity Ideas For Conferences
- What Are The Top Trade Show Lead Retrieval Tools
- Trade Show Follow Up Email Examples
- Conference Lead Capture Tools
- Trade Show Lead Capture App
Frequently Asked Questions
Why is measuring trade show ROI so difficult if the formula is just basic math?
The formula itself is simple arithmetic, but the real failure is structural, it happens before anyone opens a spreadsheet. Because 90% of new contacts never enter the CRM due to the manual effort required, the lead count feeding the formula is quietly understated from the start, which makes cost per lead look inflated, conversion rates look weak, and pipeline look thin even when the show actually performed well.
What is the step-by-step formula for calculating trade show ROI?
Take total revenue generated from the show, subtract your total investment, divide that result by total investment, then multiply by 100, for example, a $40K investment that produces $140K in revenue yields a 250% ROI. The critical discipline is that total investment must include the full cost stack: booth rental, union labor, drayage, freight, travel, staff time, and marketing materials, not just the headline booth fee, because omitting any of those inflates your apparent ROI and makes show-to-show comparisons meaningless.
How long after the show should I keep tracking revenue before calculating ROI?
Track revenue over a 6-to-12-month window, not 30 to 90 days. B2B sales cycles routinely run 12 months or longer, so a quarterly ROI snapshot will structurally miss the majority of revenue the show actually generated, a deal that closes in month eight from a February show contact simply disappears from a 90-day attribution report, and the show gets cut from next year's budget based on a number that was never complete.
Should I include open pipeline deals in my ROI calculation, or only closed revenue?
Including open pipeline in the numerator is correct, because excluding in-progress deals systematically understates the channel's contribution across a long B2B sales cycle. The required discipline is applying an honest discount rate, for example, applying a 30% close rate to a $200K qualified pipeline adds $60K in estimated revenue to the numerator alongside any already-closed deals, but that discount rate is only credible if the underlying lead data is complete and accurately captured.
What trade show costs do teams most commonly forget to include in their ROI denominator?
Drayage and union labor are the most frequent omissions, drayage is billed by the hundredweight and can rival the booth rental itself, while union labor for setup and teardown compounds costs further at major venues. Shipping, electricity, internet hookups, and the amortized cost of booth fabrication are also routinely left out, and collectively logistics and show services alone add 30 to 50 percent on top of the base booth fee.