.avif)


22 Virtual Event Success Metrics to Track in 2026
On This Page
Registration counts fill dashboards. They do not fill pipelines. Here is the pre, during, and post-event metrics framework that connects every attendee touchpoint to closed revenue your CFO can actually see.
Virtual events have never been cheaper to run or harder to justify. The common assumption among most heads of marketing and chief marketing officers is that tracking registrations and attendance rates is sufficient to prove virtual event ROI to leadership. Yet as the global virtual events market heads toward an estimated $500 billion by 2027, more budget is flowing into webinars, digital summits, and hybrid conferences than ever before, and most marketing teams walk into budget reviews armed with the same three numbers: registrations, attendance rate, and post-event survey scores. See our digital business card for how this works in practice.
Those numbers describe a crowd. They do not describe a pipeline. Registration counts and attendance rates fall squarely into the other 77 percent's reporting stack: visible, tidy, and meaningless to a CFO who wants to know which deals the event touched. Event data fractures at three predictable moments. First, registration platforms capture pre-event data in one system. Second, live engagement (poll responses, Q&A submissions, session depth) sits inside the event platform with no automatic path to your CRM.

Third, post-event contacts land in badge-scan exports or reps' personal inboxes, where, according to industry research on trade shows, reply rates drop 3× after just 72 hours, meaning every hour between a meaningful attendee interaction and a timestamped CRM record is conversion velocity lost. Without a continuous data thread from registration through closed-won, every metric lives in a different silo. Leadership cannot connect a single attendee interaction to a closed deal, and every budget review becomes a negotiation over approximations rather than a presentation of evidence.
23% of B2B marketers can accurately measure campaign ROI
Key takeaways
- Registration counts measure the size of your email list far more reliably than they measure pipeline quality, 55% of webinar registrants never show up, so the number in your deck is already half fiction before the event goes live.
- 90% of new contacts never make it into a CRM because manual data entry is too much effort, and every hour a lead sits outside your system after an event, its conversion probability is decaying.
- The metrics that survive a finance review are not attendance rate and NPS, they are cost per qualified lead, pipeline influenced, and whether the content kept generating conversions after the live stream ended.
- A 22-metric dashboard built on manually entered lead records is not a measurement system; it is a best-guess document that collapses the moment a CFO asks where the leads actually came from.
- The attribution gap between event interactions and CRM pipeline is not a follow-up problem, it is a data architecture problem that starts the moment a rep pockets a badge-scan printout or accepts a paper card.
- Mobilo Card closes that gap by letting reps share contact details and capture leads with one tap, syncing every exchange directly into your CRM in real time, no manual entry, no spreadsheet graveyard, no attribution guesswork.
The Pre, During, and Post-Event Metrics Framework That Connects Registrations to Revenue
The framework begins with a single premise: every stage of the event lifecycle must connect to a measurable pipeline signal, or the data is decorative. The common assumption among heads of marketing and chief marketing officers is that tracking registrations and attendance rates is sufficient to prove virtual event ROI to leadership. But the data tells a different story before a single session goes live: according to Vendelux's event marketing benchmarks, 85% of event marketers say they struggle to measure the ROI of their events.
That number isn't a technology problem. It's a structural one. Most teams treat pre-event, during-event, and post-event measurement as three separate reporting jobs, each owned by a different tool, each producing data that never speaks to the others.

The result is exactly what field marketing and event teams dread: leads captured at cost that never reach the CRM pipeline cleanly enough to count toward revenue.
Virtual Event Metrics vs. KPIs - How to Turn Registration Data Into Pipeline Decisions
85% of event marketers struggle to measure ROI
A metric is a number. A KPI is a number with a decision attached to it. Registration count is a metric. Registration-to-ICP match rate is a KPI. When a CMO walks into a quarterly review, the CFO isn't asking how many people registered. The question is how many of those registrants became pipeline.
If your event data can't answer that, you're presenting metrics, not KPIs. The failure is that those numbers are never connected to a revenue outcome. Session attendance rates live in the webinar platform. UTM parameters tracked in Google Analytics never map to a CRM contact record. Engagement scores stay locked inside the event tool, invisible to the sales rep who follows up three days later with no context. As Momencio's analysis of event ROI leakage makes clear, leads slip away not because they weren't captured, but because the handoff between capture and follow-up is broken.
The fix isn't more data; it's tools that capture leads efficiently and feed that data directly into the CRM pipeline, so the sales rep following up on day three has full context rather than a cold name on a spreadsheet. That's the precise problem Mobilo's Teams and Business plans are built to close. Both plans include lead capture and management, lead enrichment, and 6,000 integrations through Zapier, meaning every contact tapped or scanned at a virtual or in-person event flows directly into whatever CRM or marketing automation platform your revenue team already uses, without a manual re-entry step.
The Teams plan starts at $4/month (billed annually) and supports unlimited team members, making it practical to arm every field marketing rep or event staff member at scale. The Business plan, at $5/month (billed annually), adds enterprise SSO, HR directory sync, a custom domain, and white-glove onboarding for teams of 100 or more, the infrastructure layer that keeps contact data clean and attributable across a large organization.
Pre-Event Metrics Are Marketing Quality Signals, Not Just Registration Counts
Registration source, ICP match rate, landing page conversion rate, and email engagement from nurture sequences together tell you whether you're filling seats with buyers or browsers. Pre-event data is where pipeline quality is set, not where it's measured after the fact. If 60% of registrants came from a paid channel but only 12% match your ICP, you have a targeting problem that no during-event polish will fix.
Field marketing teams we work with consistently find that pre-event targeting waste is compounded by collateral spend that produces no data trail. Printed materials handed to unqualified attendees generate no signal. Mobilo's Paper Plus Cards and NFC cards, available under both the Pro and Team tiers, replace static printed collateral with tappable contacts that log every interaction, so pre-event outreach and live event touchpoints both feed the same data thread.
Reducing wasteful spend on printed collateral while demonstrating marketing's contribution to pipeline and revenue isn't a philosophy; it's the mechanical outcome of replacing one-way print with two-way digital capture from the first touchpoint.
Post-Event Virtual Event Success Metrics That Connect Directly to Revenue
Cost per qualified lead, pipeline attribution rate, and attendee-to-MQL conversion rate are the three post-event numbers that survive a CFO review. Each one requires a clean data thread from the moment of contact capture. Without it, the figures below are estimates, not evidence. Vendelux's event marketing research reinforces this: teams that cannot close the loop between contact capture and CRM record consistently underreport event-influenced pipeline, which in turn weakens the budget case for future events.
Capture and follow up on leads more efficiently at networking events and in the field, and that underreporting problem disappears. With Mobilo's unlimited leads and contacts, insights and analytics, and custom lead capture forms, included on every plan from Pro ($3/month) through Teams ($4/month) and Business ($5/month), the data thread from first tap to closed-won is unbroken and auditable. Section 4 covers each metric in full.
Quick-Reference - Pre, During, and Post-Event Virtual Event Success Metrics
Event marketing works best when each stage has a clear metric, signal, and decision attached to it:
- Pre-event — Registration-to-ICP Match Rate → Signals audience quality → Adjust targeting before the event.
- Pre-event — Registration Velocity Curve → Signals buyer urgency → Increase or reduce paid spend.
- Pre-event — Seniority Distribution → Signals decision-maker density → Consider co-promotion if director-level attendees are below 20%.
- During — Average Watch Time → Signals content consumption depth → Prioritize follow-up by engagement quartile.
- During — Q&A Submission Volume → Signals purchase intent → Flag engaged attendees for same-day outreach.
- During — Live Poll Participation Rate → Signals session engagement quality → Feed engagement data into CRM lead scoring.
- Post-event — Cost per Qualified Lead (CPQL) → Signals demand-generation efficiency → Guide channel budget allocation.
- Post-event — Pipeline Attribution Rate → Signals event-influenced revenue → Support CFO reporting and budget decisions.
- Post-event — Attendee-to-MQL Conversion Rate → Signals content-to-pipeline fit → Refine future ICP targeting.
- Post-event — On-Demand Content Consumption Rate → Signals reach beyond the live event → Gate replays to capture leads.
Related Reading
- Etiquette For Networking In Online Conferences
- Measuring Event Roi
- Trade Show Sales Tips
- Trade Show Follow Up Best Practices
- How Do You Find The Roi Of A Trade Show
- Trade Show Sales Funnel
- What Is Trade Show Marketing
- Event Lead Management
- B2b Trade Show Best Practices
- Conference Lead Generation
- B2b Trade Show Marketing
Attendee Registration and Participation Rates - The 7 Pre-Event Metrics That Predict Pipeline Quality
A registration count feels like proof. It lands in the weekly update deck, earns a nod from the CFO, and gets screenshotted for the post-mortem. The problem is that it measures the size of your email database far more reliably than it measures the size of your addressable market.
According to Zoom's 2025 webinar research, roughly 55% of webinar registrants come from email marketing, making it the top registration source channel. When half that list never attends, and a fraction of those who do match your ICP, the headline number stops being a signal and starts being a distraction. One of the most consistent traps event marketing teams fall into is optimizing for low cost-per-registrant.
Broad-reach campaigns fill the registration form, but the leads who arrive that way are often curious, not urgent. They don't show up, they don't convert, and they leave sales reps manually sifting a raw export looking for anyone worth calling. The problem isn't volume; it's that volume-first tactics actively obscure the quality signal you need before the event even opens. The pre-event metrics that actually predict pipeline quality are quieter, more specific, and almost never shown on the default event platform dashboard.
Here are the seven that matter.
1. Registration-to-Attendee Conversion Rate - Your Pipeline Purity Baseline
Image: Virtual Event Success Metrics - registration to attendee conversion.png)
The ratio of registrants who actually show up live is the single most revealing pre-event virtual event success metric for pipeline quality. A healthy rate sits between 40–60%; anything below 35% signals audience-intent mismatch or weak reminder sequences. The core tradeoff: optimizing purely for registration volume inflates this denominator and masks how few genuinely qualified buyers are in the room.
2. ICP Match Rate Among Registrants - Filtering Signal from Noise Before Day One
ICP match rate is the percentage of registrants whose firmographic profile (company size, industry, revenue band, and buying role) aligns with your ideal customer profile. Teams that track this as a standalone pre-event metric see two to three times higher post-event pipeline conversion rates, according to industry research. The honest limitation: most registration forms do not collect enough firmographic data to score ICP fit without enrichment.
That is where a structured capture workflow closes the gap. Mobilo's NFC and QR-enabled cards, including the Custom Design Card and Metal Custom Design Card available under the Team tier, let reps capture leads from events and field meetings directly into the CRM without relying on anyone to manually log a contact. Because the Teams plan includes lead enrichment and integrates with 6,000 tools through Zapier, enriched firmographic data can flow into your ICP scoring model in real time, before the first session goes live, rather than arriving as a post-event cleanup job.
3. Registration Velocity Curve - Timing Patterns That Predict Buyer Urgency
Image: Virtual Event Success Metrics - registration velocity curve timing.png)
The shape of your registration curve reveals intent. Early registrants, those who sign up more than seven days before the event, consistently show higher attendance rates and higher post-event sales-conversation rates than last-minute sign-ups. A flat curve that spikes only in the 24 hours before the event suggests your audience is curious but not urgent. A curve that builds steadily from the moment registration opens signals genuine demand. Optimizing for low cost-per-registrant through broad-reach campaigns tends to produce the flat spike pattern, not the steady build, and by the time you see the spike, it is too late to correct the channel mix.
4. Job-Title and Seniority Distribution - Knowing If Decision-Makers Are Actually Registered
Fewer than 20% director-level or above registrants is a reliable early signal that SQL conversion will be low regardless of total attendance volume. A list of 2,000 registrants where most are individual contributors produces fewer qualified opportunities than a tighter list of 400 where the majority hold budget authority. Pull seniority distribution the moment registration opens, not after the event closes. If the mix is wrong early, there is still time to adjust promotion channels or add a partner co-promotion that reaches a more senior audience.
5. Multi-Session Registration Rate - Identifying High-Intent Repeat Engagers
When a prospect registers for more than one event in your series, that behavioral signal is among the strongest pre-event virtual event success metrics for predicting sales-readiness. Multi-session registrants demonstrate active research behavior and topic commitment that single-event attendees rarely match. The limitation is that this metric only becomes meaningful after you've run at least two related events, making it inaccessible to teams launching a new virtual program.
6. Registration Source Attribution - Which Channels Deliver Qualified Buyers vs. Volume
Registration source tracking via UTM parameters answers the question that cost per registrant (CPR) alone cannot: which channel sends people who actually show up and convert? A LinkedIn sponsored post might deliver 300 registrants at a higher CPR than an email newsletter, but if those 300 registrants have a 58% attendance rate and a 40% ICP match rate while the newsletter delivers 600 registrants at 22% attendance and 9% ICP match, the math on qualified pipeline favors the more expensive channel. The average webinar landing page conversion rate of 30–40% is a useful reference point, but source-level attendance and ICP data is the primary signal.
Most CMOs discover their pre-event ICP match rate problem too late, after the event, when sales reps are manually sifting a raw registrant export. Teams that route pre-event and in-event contact exchanges through a structured digital capture workflow close that gap earlier. Mobilo's Teams plan ($4/month per member, billed annually) pairs NFC and QR-enabled cards with lead enrichment, team management, and full team data analytics, so marketing gets visibility into which reps are actively networking and converting connections into pipeline, not just who has the most contacts in a spreadsheet.
Because the plan includes unlimited leads and contacts, centralised billing, and CRM integrations through Zapier, every captured contact flows into your pipeline management workflow automatically, giving your team a real-time ICP match signal rather than a post-event data-entry backlog.
7. Reminder Email Engagement Rate - The Pre-Event Behavioral Proxy for Show-Up Intent
Whether a registrant opens and clicks your confirmation and reminder emails is a measurable behavioral signal that predicts live attendance far better than registration alone. Registrants who engage with at least two pre-event emails show up at rates 30–40% higher than those who don't, making this a practical virtual event success metric for prioritizing day-of sales outreach. The key limitation is that email engagement data is increasingly unreliable due to Apple Mail Privacy Protection inflating open rates.
Audience Engagement Metrics to Monitor During a Live Virtual Event
Live engagement data is the most underused pipeline signal in B2B event marketing. While most recap decks celebrate total attendees and peak concurrent viewers, the CMOs who consistently win budget reviews are reading a different set of numbers entirely: the behavioral signals that separate a passive viewer from a buyer who is actively evaluating a purchase. According to Goldcast's 2025 B2B Webinar Benchmark Report, the average attendee-to-registrant rate across more than 19,000 B2B webinars sits at roughly 40 to 45 percent, meaning the majority of registrants never attend. That means the majority of people who registered never showed up, and a meaningful slice of those who did were present in name only. Raw attendance figures cannot tell you which attendee had three browser tabs open and which one submitted two questions and downloaded your pricing guide. That distinction is where pipeline lives.
That distinction is where pipeline lives.
The eight metrics below are not audience satisfaction scores. They are lead-scoring inputs. Each one measures a different dimension of intent, and understanding their hierarchy changes how your team prioritizes post-event follow-up. Every customer-facing touchpoint, including how your team shows up at and after an event, should consistently reflect your brand identity and drive measurable engagement; the metrics that follow are the mechanism by which you prove that it does.
1. Live Attendance Rate - The Baseline Virtual Event Success Metric
Image: Virtual Event Success Metrics - live attendance rate baseline.png)
Live attendance rate measures the percentage of registrants who actually join your event in real time, with B2B benchmarks typically landing between 35–45%. It's the first number event marketers check because it validates promotion strategy and topic relevance. The key tradeoff: a high attendance rate alone doesn't confirm quality engagement, attendees may join and immediately multitask without absorbing content.
2. Session Drop-Off Rate - Where Attendee Interest Actually Breaks Down
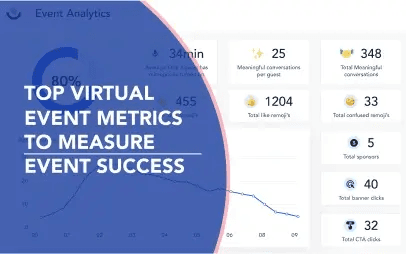
Session drop-off rate maps exactly when attendees stopped watching, giving you a content diagnostic no post-event survey can replicate. A sharp drop at minute eight usually means the opening failed to establish relevance. A cliff at minute 22 often signals a topic pivot that lost the audience. The limitation here is that drop-off data tells you where interest broke, not why, so pair it with chat sentiment from the same timestamp to build a complete picture.
Average Watch Time, Measuring True Content Consumption Depth Average watch time is among the strongest session-level predictors of post-event conversion. Zoom's that same figure webinar research found that webinars with interactive elements see up to 60% higher engagement rates compared to broadcast-only sessions. Demand generation teams that segment post-event follow-up by watch-time quartile consistently find it to be their top lead-scoring variable, surfacing the highest-intent prospects before a single outreach email is sent. Segment your follow-up list by watch-time quartile before handing it to sales and the conversation velocity difference becomes immediately visible.
3. Average Watch Time - Measuring True Content Consumption Depth
Average watch time calculates how many minutes attendees remain actively viewing your live virtual event, distinguishing passive presence from genuine content consumption. For B2B webinars, longer average watch times correlate strongly with higher post-event conversion rates. The tradeoff is that averages can be skewed by a small cohort of highly engaged viewers, masking the reality that a large portion of attendees may have dropped off within the first ten minutes.
4. Live Poll Participation Rate - A Real-Time Pulse on Audience Attention
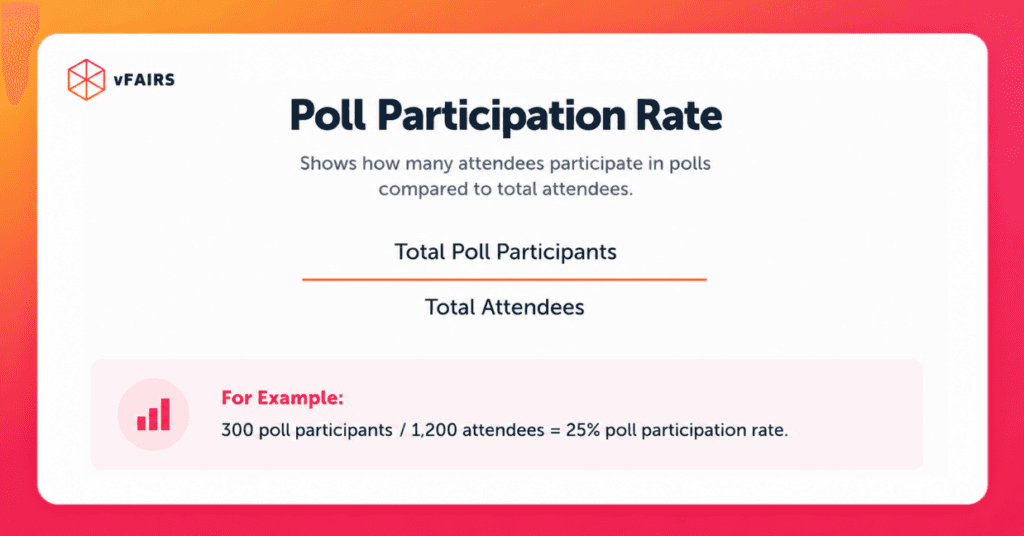
Poll response rate is a real-time proxy for session participation quality. A healthy benchmark sits between 25 and 40 percent of live attendees responding to any given poll. The more important use of poll data is downstream: a poll that asks attendees to self-identify by company size or buying stage feeds directly into CRM lead scoring, turning a simple engagement feature into a segmentation tool your sales team can act on the same afternoon.
5. Q&A Submission Volume - Gauging Intellectual Investment in Your Topic
Q&A submissions are the highest-intent signal available during a live virtual event. A question requires cognitive effort, a willingness to be seen, and a specific gap in the attendee's knowledge that your content surfaced. According to Zoom's that same figure data, engagement depth metrics like Q&A submissions are stronger pipeline signals than passive presence metrics such as emoji reactions. Flag senior-title submitters for same-day outreach; their questions are buying signals wearing a curiosity disguise.
6. Emoji Reaction and Raise-Hand Rate - Lightweight Engagement Signal Tracking
Emoji reactions and raise-hand events are the weakest signals in this hierarchy. They require almost no cognitive investment and correlate poorly with purchase intent on their own. Their real value is additive: when a senior-title attendee reacts to a pricing-related slide and later submits a Q&A question, the combination of two signals, even if each is weak alone, moves them up the follow-up priority list. Use them as a tiebreaker input to your lead-scoring model, not as a standalone KPI.
7. Chat Message Volume and Sentiment - Monitoring Community Energy in Real Time
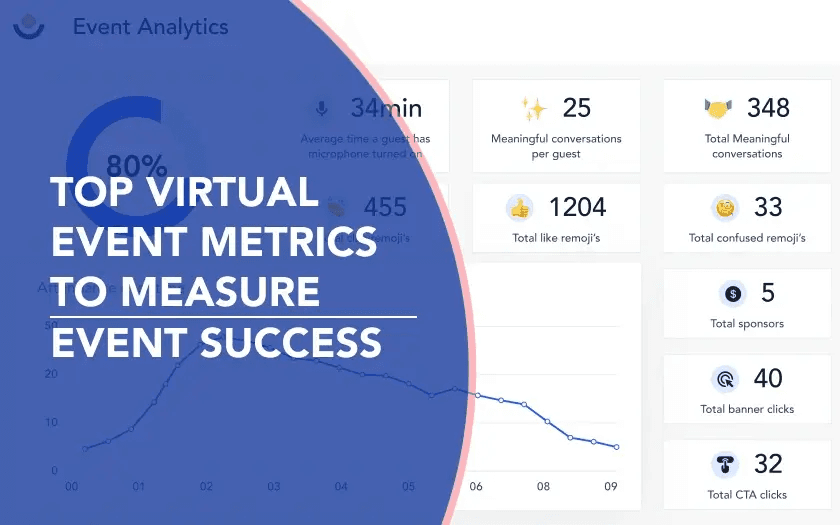
Chat message volume tracks how actively attendees are communicating during a live virtual event, while sentiment analysis layers in whether those conversations are positive, neutral, or critical. Together they give event teams an unfiltered view of audience energy and content reception without waiting for post-event surveys. The limitation is that chat activity is heavily influenced by moderator behavior, sessions with active hosts generate significantly more chat volume, which can distort cross-event comparisons.
8. Resource Download and CTA Click-Through Rate - Connecting Engagement to Intent
Resource download rate and CTA click-through rate measure how many attendees take a deliberate action during or immediately after a live virtual event, downloading a whitepaper, clicking a demo link, or registering for a follow-up session. These metrics bridge audience engagement and pipeline generation, making them critical virtual event success metrics for revenue-focused teams. The tradeoff is attribution complexity: clicks during a live session may reflect curiosity rather than purchase intent, requiring CRM follow-up to validate quality.
Post-Event Metrics That Measure ROI, Pipeline, and Long-Term Success
CFOs don't fund events on applause. They fund them on pipeline numbers, and the post-event report that leads with attendance rate and NPS score is the one that gets the budget cut. The metrics that actually survive a finance review map directly to revenue outcomes: what did each qualified lead cost, how much pipeline did this event influence, and did the content keep working after the live stream ended?
Event ROI Event ROI is calculated as (Revenue minus Costs) divided by Costs, multiplied by that same figure. According to WebinarNinja's research, webinars generate an average of $1 in revenue for every $1 spent, with top-performing webinars achieving ROI multiples of 3: 5x when pipeline influence, not just closed-won deals, is factored in. Reporting closed-won-only attribution systematically understates true event value and overstates cost-per-lead, because most deals influenced by an event close weeks or months after the event itself. A CFO-ready ROI model must incorporate multi-touch pipeline data.
Net Promoter Score
NPS collected via post-event surveys is the qualitative signal that predicts future pipeline. It is worth noting that NPS is a lagging indicator: it tells you whether the last event built brand equity, not whether it generated pipeline today. Treat it as a long-term brand metric that sits alongside revenue metrics, not as a substitute for them.
1. Pipeline Attribution Rate - Connecting Event Touchpoints to Closed-Won Revenue
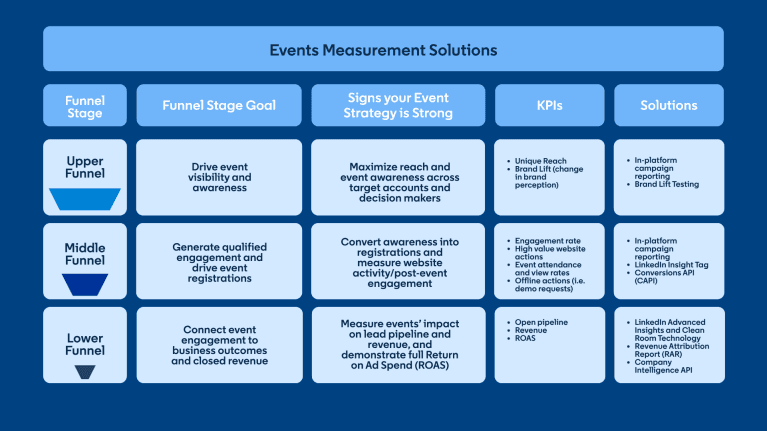
Pipeline attribution rate measures what percentage of post-event leads actually progressed to opportunities and closed deals, tracked inside your CRM. It's the definitive ROI proof point for CFOs and CMOs demanding hard numbers. The core tradeoff: multi-touch attribution models require clean CRM hygiene and consistent lead tagging from day one, which many teams underinvest in before the event itself.
2. On-Demand Content Consumption Rate - Measuring Long-Tail Audience Reach Post-Event
Image: Virtual Event Success Metrics - on demand content consumption.png)
On-demand replay views function as a reach multiplier that post-event attendance figures never capture. A virtual summit with 400 live attendees can generate hundreds of additional content touches through gated replay access, and each view is a second lead-capture opportunity. What most teams report is that on-demand sessions extend audience reach well beyond the live window, meaning total content reach and lead generation cannot be measured by attendance alone. If your reporting stops at live attendee count, you are undercounting both audience size and pipeline potential.
3. Attendee-to-MQL Conversion Rate - Quantifying Lead Quality From Virtual Event Registrants
This metric tracks what percentage of attendees crossed your lead-scoring threshold and became Marketing Qualified Leads within a defined post-event window, typically 30 to 60 days. It is the clearest signal of content-to-pipeline fit: a high attendance rate paired with a low conversion rate means the audience was not the right audience, regardless of how engaging the sessions felt. Teams that optimize for registration volume without ICP filtering consistently see this number collapse, even when raw attendance looks strong.
4. Behavioral Lead Scoring Uplift - Ranking Attendees by In-Event Engagement Signals
Assigning score increments based on in-event behaviors, poll responses, resource downloads, Q&A participation, session duration, lets sales teams prioritize outreach by actual buying intent rather than registration status alone. This is the right approach for B2B teams with long sales cycles and limited SDR bandwidth. The tradeoff is model maintenance: scoring weights need quarterly recalibration as event formats and buyer behaviors evolve.
5. Cost Per Qualified Lead (CPQL): Benchmarking Virtual Event Efficiency Against Other Channels
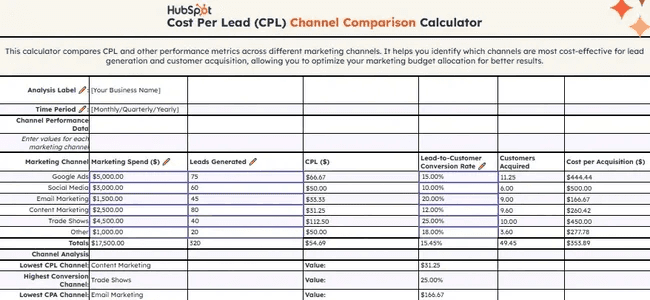
Cost Per Qualified Lead (CPQL) is calculated by dividing total event spend by the number of sales-ready contacts that entered the CRM. It is the single metric that connects your event budget to demand generation efficiency. Across the market, virtual event CPL benchmarks well below in-person equivalents, which makes it a compelling channel-mix argument for CMOs defending spend. The critical word is "qualified": contacts without ICP match data or lead scores inflate the denominator and make the number look better than it is.
6. Sponsor and Partner ROI Metrics - Tracking Exposure, Leads, and Deal Influence for Event Backers
Image: Virtual Event Success Metrics - sponsor partner roi tracking.png)
Sponsors evaluate virtual events on logo impressions, booth visit counts, lead capture volume, and pipeline influenced, not just brand awareness. Providing sponsors with a structured post-event ROI report dramatically improves renewal rates and upsell potential for future events. The tradeoff: collecting granular sponsor-specific data requires dedicated tracking infrastructure built before the event, not retrofitted afterward when data is already lost.
7. Net Promoter Score (NPS) and Audience Sentiment - Predicting Long-Term Brand and Community Value
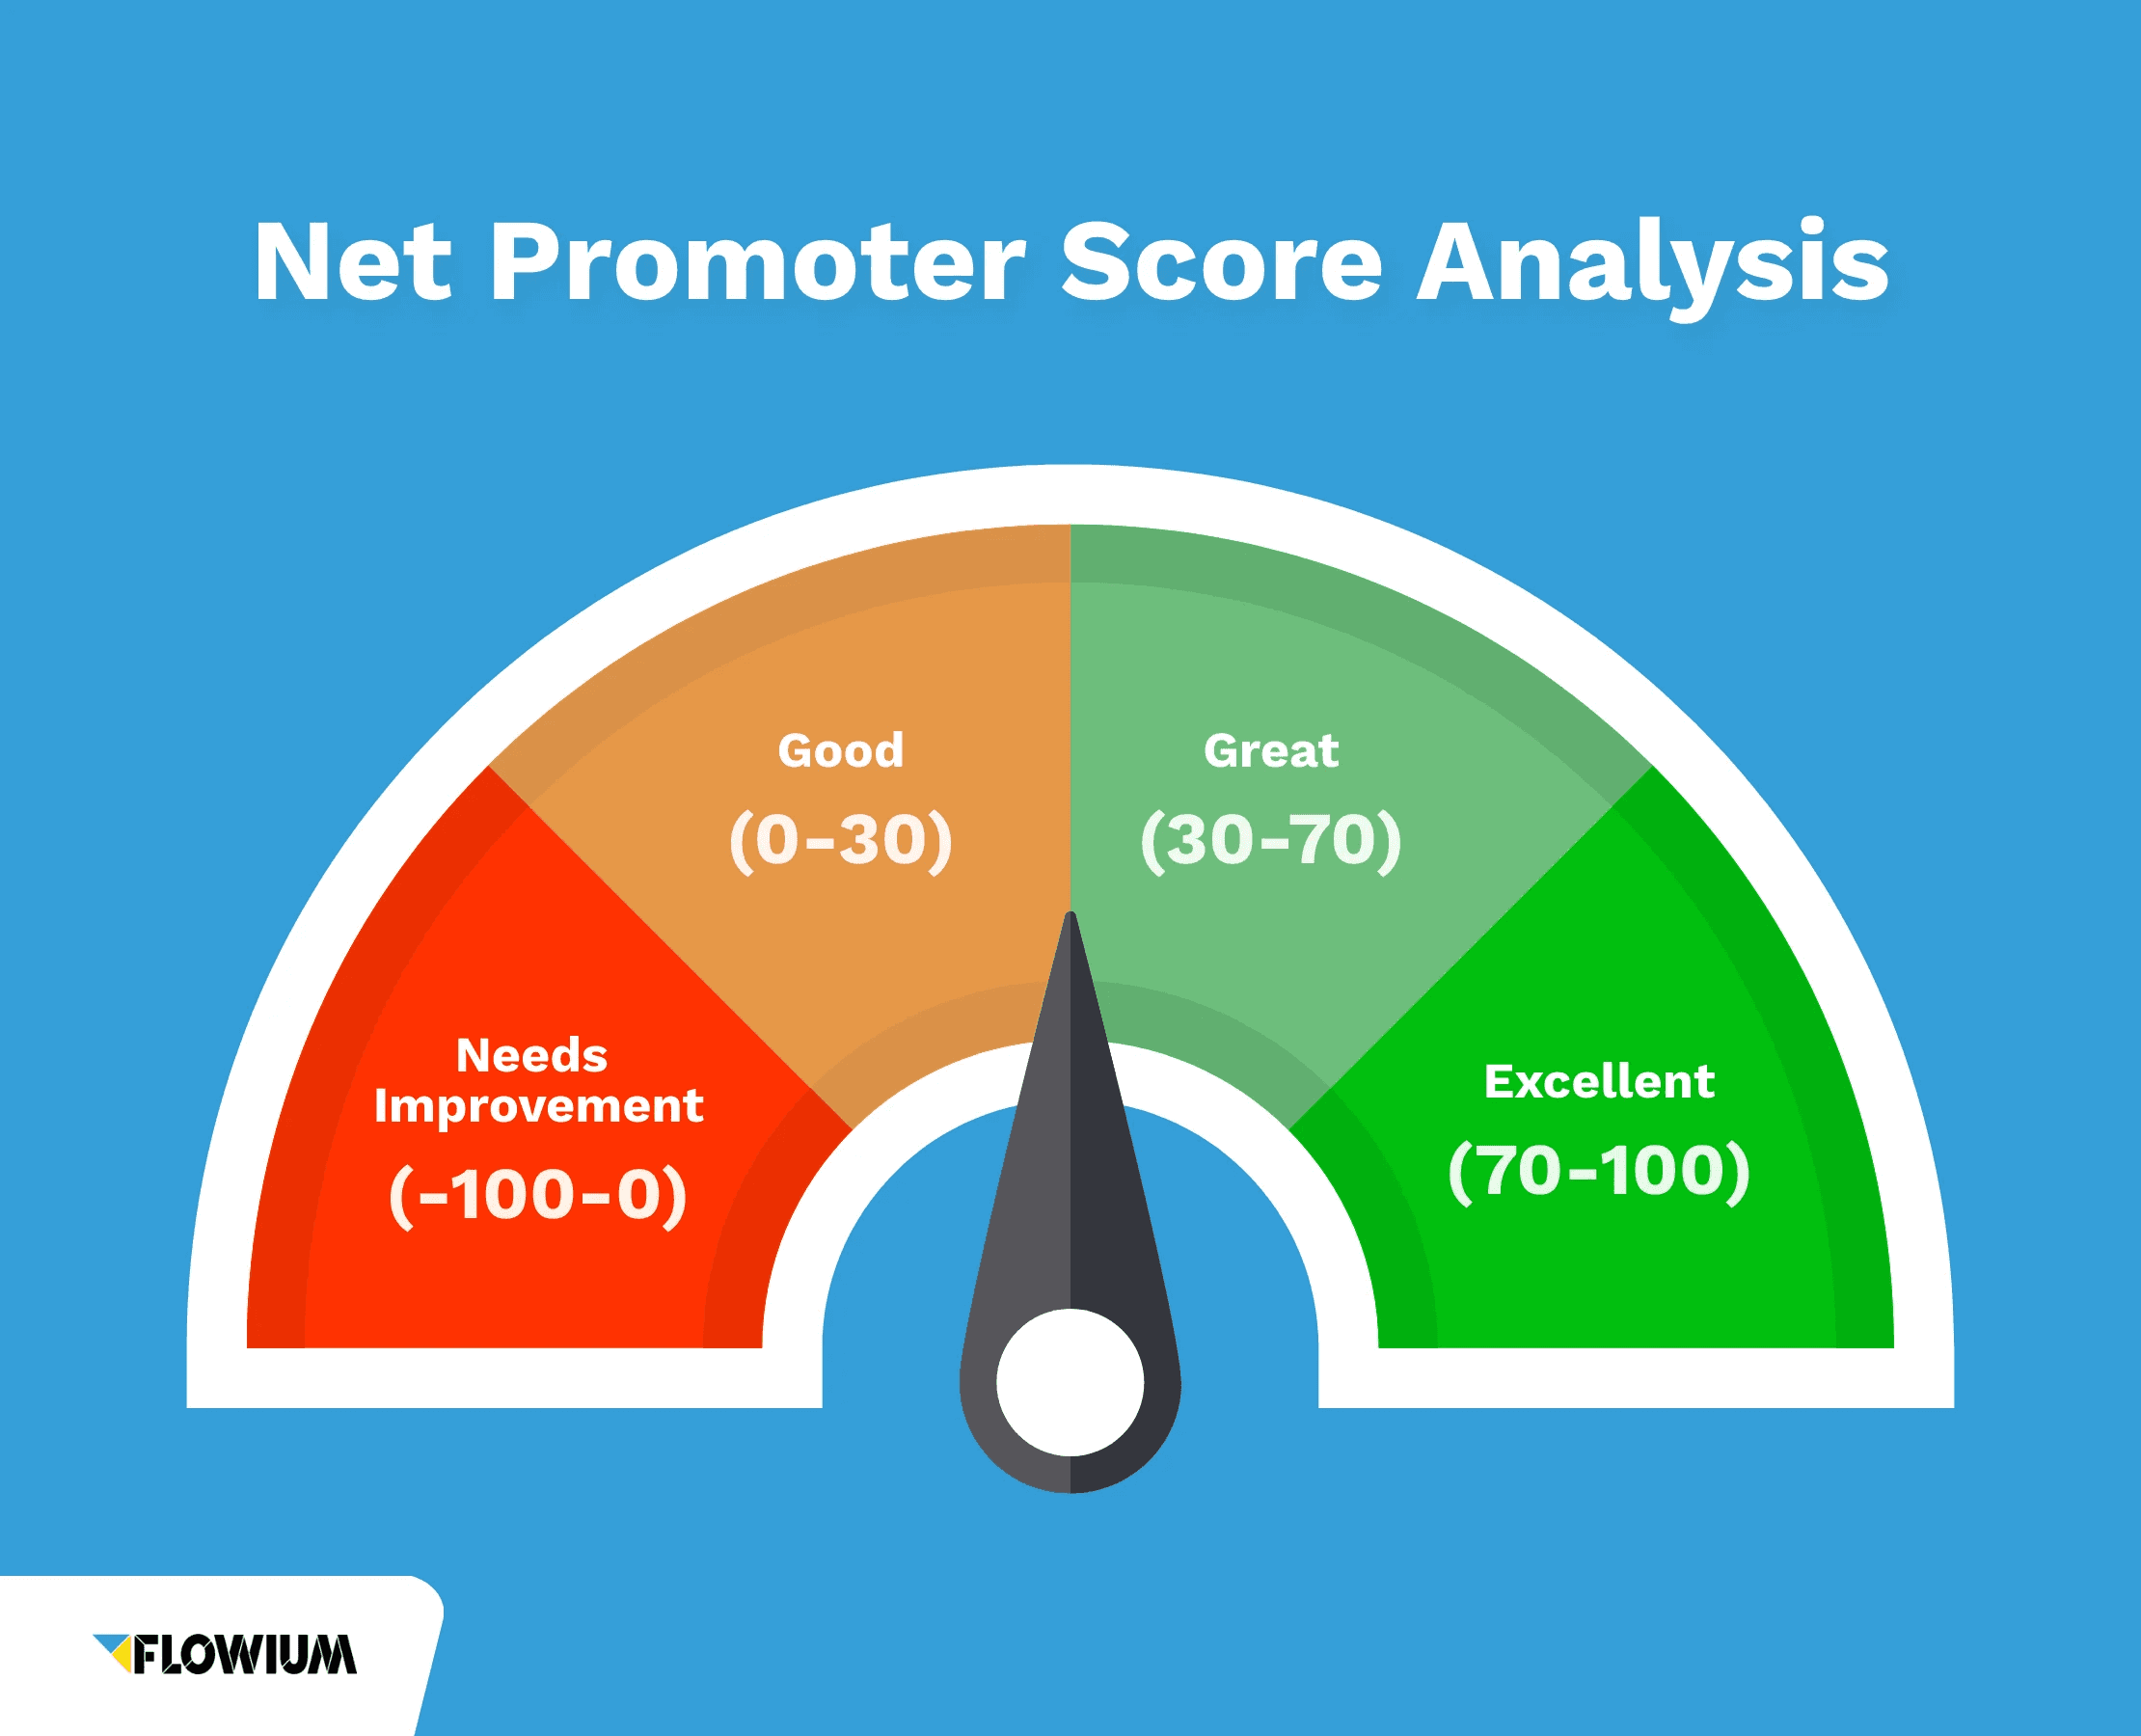
Post-event NPS surveys and qualitative sentiment analysis measure whether attendees would recommend your event and brand to peers, a leading indicator of community growth, organic referral traffic, and future registration rates. This metric is especially valuable for recurring event series where audience loyalty compounds over time. The limitation: NPS is a lagging sentiment signal that doesn't directly translate to near-term pipeline, making it harder to defend in short-cycle budget reviews.
Related Reading
- Which Networking Software Is Best For Conferences
- Trade Show Booth Ideas To Attract Visitors
- Conference Lead Capture
- How To Measure Trade Show Effectiveness
- Trade Show Roi
- Trade Show Lead Generation Ideas
- What's The Best Event Lead Generation Software
- Post-Trade Show Marketing Strategies
- Best Trade Show Giveaways
How Automated Lead Capture Closes the Attribution Gap Between Event Interactions and CRM Pipeline
Automated Lead Capture and the Attribution Gap
Every hour a lead sits outside your CRM after an event, its conversion probability is decaying. That is not a follow-up problem. It is a data architecture problem, and it starts the moment a rep pockets a badge-scan printout or accepts a physical card. The sections below explain where the gap opens, why it compounds, and how real-time NFC and QR-to-CRM capture closes it structurally.

The 24 to 72-Hour Data Entry Lag
"Leads captured through various channels (ads, direct mail, social monitoring) are siloed and not automatically funneled into a CRM, creating a manual gap between event interactions and pipeline tracking."
Manual data entry after events creates a structural gap that corrupts every downstream metric. Reply rates drop 3× after 72 hours of post-event follow-up delay, according to BoothMaven's trade show research. The contacts most likely to convert are the ones reached first, yet the typical badge-scan-to-CRM workflow burns through that window before a single outreach email is sent.
This is a pattern teams that attend events regularly run into again and again: leads captured through multiple channels, a badge scan here, a manually collected card there, a LinkedIn connection made on the show floor, land in separate places and are never automatically funneled into the CRM. The result is a manual gap between the moment of contact exchange and the moment a pipeline record exists. Worse, the original interaction timestamp is lost entirely during manual entry, making CPL, lead conversion rate, and pipeline influence impossible to calculate with any accuracy. You cannot audit a metric whose starting point was never recorded.
Contact Conversion Gravity
Every friction point between a contact exchange and a CRM record is a dropout event. Think of each manual step as a small hole in a bucket. A rep scans a badge. The export sits in an inbox. Someone maps columns in a spreadsheet. A manager reviews for duplicates. By the time the record lands in Salesforce, some contacts have already gone cold, some were never entered at all, and a significant share of event leads simply vanish before they become pipeline records.
Dropout events are invisible in post-event reporting. Sales and marketing teams that rely on manual lead capture at events face exactly this compounding failure: the gap between an interaction on the event floor and a qualified record in the pipeline is not one step but many, and each step is an opportunity for the lead to disappear. The teams that close this gap structurally, rather than relying on rep discipline, are the ones whose post-event pipeline numbers are trustworthy.
NFC and QR-to-CRM in Real Time
When an event rep taps a prospect's phone with a Mobilo digital business card, the contact record, carrying the event name, interaction timestamp, and rep owner already assigned, can sync directly to the CRM at the moment of exchange. This is most valuable for teams that attend events regularly and need structured lead follow-up built into the workflow itself, not bolted on afterward by a CRM admin working through a spreadsheet export. Based on our market understanding, manual badge scans and paper business card collection create a 24–72 hour data entry lag before contacts reach the CRM, collapsing contact-to-opportunity conversion velocity during the highest-intent window post-event.
A Head of Marketing can pull a live post-event pipeline report hours after the event closes rather than weeks later, because the data pipeline began at the tap, not at the keyboard. Mobilo's NFC and QR-enabled cards, available across card types including Custom Designed NFC Cards with QR Code, Digital Wallet Cards, and Paper Plus Cards, write that record directly into the CRM at the moment of contact exchange, transforming what was a paper artifact into the first auditable data point in a pipeline journey. The Teams plan ($4/month per member, billed annually) and Business plan ($5/month per member, billed annually) both include lead enrichment, lead capture and management, unlimited leads and contacts, insights and analytics, and integrations through Zapier, giving the CRM admin responsible for integration setup a structured, automatable pipeline rather than a manual import process.
The BoothMaven data makes the cost of the alternative concrete: reply rates drop 3× after just 72 hours, and manual badge-scan workflows almost guarantee that window is already closed before the first outreach is sent.
From Interaction Timestamp to Pipeline Stage
The gap between an interaction timestamp and a pipeline stage is closed by one structural decision: every contact captured at an event must carry four fields from the moment of creation, source event, rep owner, interaction date, and ICP qualification signal. When those four fields exist on day one, Cost per Lead and lead conversion rate become auditable calculations. When any one is missing, they become estimates.
Mobilo's CRM sync writes all four automatically at the point of tap or scan, so the attribution chain is intact before the event floor clears. For teams operating at scale, the Business plan additionally includes team management, central billing, HR directory sync, custom lead capture forms, and, for larger deployments, white-glove onboarding and a custom-built landing page, giving both the individual cardholder and the CRM admin the infrastructure to make post-event attribution a repeatable system rather than a best-effort reconstruction. The Teams plan mirrors that capability for growing teams, with bulk discounts available for events, making structured lead capture economically viable at the moment a team's event calendar starts to fill up.
Related Reading
- Best Tech Conferences For Networking
- Best Networking Apps for Trade Show Attendees
- Best Finance Conferences For Networking
- Trade Show Booth Ideas For Small Budgets
- Virtual Conference Booth Ideas
- Networking Activity Ideas For Conferences
- What Are The Top Trade Show Lead Retrieval Tools
- Trade Show Follow Up Email Examples
- Conference Lead Capture Tools
- Trade Show Lead Capture App
Next steps
If your post-event pipeline conversations keep collapsing because leadership cannot trace a single attendee interaction to a closed deal, the path forward starts with eliminating every manual handoff between event touchpoint and CRM record. Start with our digital business card.
The 24-to-72-hour data entry lag created by badge scans and manual card collection does not just slow follow-up, it destroys the highest-intent conversion window and makes CPL, pipeline influence, and lead conversion rate impossible to calculate with any accuracy. Separately, reporting closed-won-only attribution systematically understates true event value, because most deals influenced by an event close weeks or months later and on-demand replays create a second lead-capture window that post-event attendance figures never count. Together, these two realities point to the same fix: automated, timestamped contact capture that feeds a clean, source-tagged CRM record at the moment of interaction, so every post-event metric has an auditable starting point. For a deeper look at how field teams are closing the capture gap in practice, see the digital business card guide.
Frequently Asked Questions
What's the difference between an event metric and an event KPI?
A metric is a number; a KPI is a number with a decision attached to it. Registration count is a metric, but registration-to-ICP match rate is a KPI, because it tells you whether to adjust targeting before the event even opens.
What counts as a healthy attendance rate for a virtual event?
For virtual events, a healthy registration-to-attendee conversion rate sits between 40% and 60%. Anything below 35% is a warning sign that your registered audience and your actual buyers are two different groups.
Which post-event numbers actually hold up in a CFO review?
Cost per qualified lead, pipeline attribution rate, and attendee-to-MQL conversion rate are the three post-event metrics that survive a CFO review. Each one requires a clean, unbroken data thread from the moment of contact capture through to the CRM, without it, the figures are estimates, not evidence.
Does on-demand content viewing after the event count as a measurable metric?
Yes, on-demand content consumption rate is included in the post's framework as a post-event metric. The post recommends gating replays for lead capture so that reach beyond the live window generates a trackable pipeline signal rather than anonymous views.
Why do so many virtual event leads never make it into the CRM pipeline?
The problem is structural, not technical: pre-event, during-event, and post-event data typically live in separate tools that never talk to each other. On top of that, reply rates drop 3× after just 72 hours, so every hour between a meaningful attendee interaction and a timestamped CRM record is conversion velocity lost.