.avif)


How to Measure Trade Show Effectiveness With 6 Key Metrics
On This Page
Most trade show measurement starts too late. Here is why lead volume is a pre-pipeline illusion, and what to track instead if you want numbers your CFO can actually trust.
Most heads of marketing and chief marketing officers think that if they capture more contacts at the booth, they are doing their job, and that lead volume is the right proxy for trade show effectiveness. This assumption shapes how trade show teams approach measurement, leading them to believe their problem starts after the show ends. They assume that if they just track the right KPIs, the ROI story will come together.
The real failure happens much earlier, and it is quieter than most CMOs expect. The gap between contacts collected on the show floor and contacts that actually reach the CRM is where trade show budgets disappear. According to a 2025 report from Never Drop, 90% of new contacts captured at trade shows never make it into the pipeline because the handoff process is manual and leaky.

See our digital business card for how this works in practice. Every downstream metric, from cost-per-lead to pipeline attribution, is built on that incomplete dataset. Tools like smart digital business cards exist precisely to close this gap before it corrupts your numbers. Badge scan counts feel like progress because they are concrete and easy to report. In practice, a scan records presence, not intent. Teams often walk away with a large contact list and a fraction of those contacts in the CRM by the time sales begins outreach. That is not a follow-up problem; it is a capture problem disguised as a reporting problem.
The failure point is the manual transfer layer. Contacts captured through any non-integrated method, scanned badges exported to a CSV, cards collected and stacked for later entry, notes typed into a personal spreadsheet, all share the same structural problem: they require a discrete data-entry step that competes with every other post-show priority. The Never Drop research (2025) confirms this pattern: the effort required to log contacts manually is enough to make most reps deprioritize it entirely, silently erasing the event's pipeline potential before sales even opens a sequence. If the majority of your show-floor contacts never entered the CRM, your average lead quality score is not a reliable signal.
Lead volume is a pre-pipeline illusion.
90% of trade show contacts never reach the pipeline
Key takeaways
- 90% of new contacts collected at trade shows never enter a CRM, not because teams don't care, but because the handoff is manual, slow, and built to leak.
- Badge scan volume and booth traffic are the metrics everyone reports and the ones that predict pipeline least, qualified conversation rate is the signal that actually matters.
- SMART goals set before the show are the only goals that survive a post-show CFO review; targets defined on the flight home are targets invented after the fact.
- Cost-per-lead calculations built on total contacts collected, rather than qualified leads that reached the CRM, produce a number that looks good in a deck and collapses under scrutiny.
- The ROI formula is straightforward; what corrupts it is the data feeding into it, specifically the contacts that decayed between the show floor and the pipeline.
- Post-show pipeline tracking needs a full 90-day window, deals attributed at 30 days routinely undercount revenue by a significant margin.
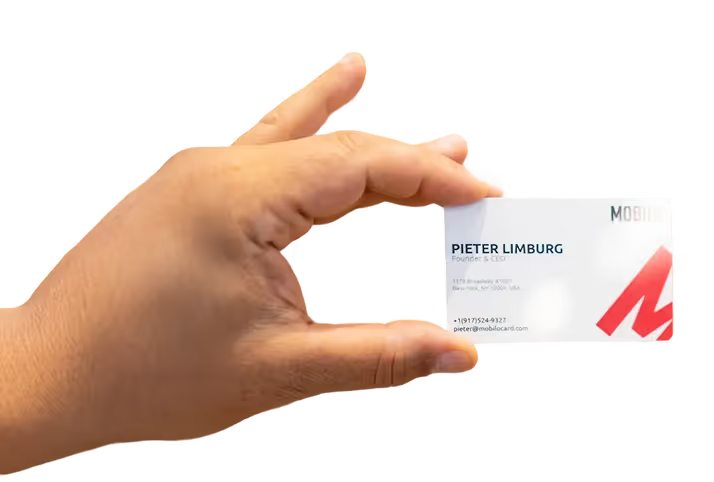
- Mobilo Card closes the capture gap by syncing every contact exchange directly into your CRM in real time via NFC, no paper cards, no manual entry, no leads left on the show floor.
Pre-Show Preparation and Objective-Setting Phase - Define Success Before You Arrive
Most exhibitors leave the show with a folder full of scanned badges and no reliable way to judge whether the event was worth the budget, because they never defined what "worth it" actually meant before they arrived. The work that determines whether your trade show metrics are diagnostic or merely descriptive happens in the weeks before the event, not on the show floor. This section covers how to set SMART objectives that give every lead captured, every contact logged, and every follow-up sent a clear standard to be measured against.

Why SMART Goals Set Before the Show Are the Only Goals That Count
SMART goals for trade shows work because they force a specific answer to one question: what does success look like on the flight home? Industry guidance consistently shows that exhibitors who define numeric, time-bound targets before the event report higher measured ROI than those who evaluate performance after the fact. The reason is structural.
Without a pre-defined target, every metric collected during the show is descriptive rather than diagnostic. You have numbers, but no signal. Here is the synthesis that explains why this matters beyond simple planning hygiene: pre-show objective-setting is the only mechanism that prevents badge-scan volume from becoming the default success metric by accident, because teams that skip it have no alternative measurement framework to fall back on, so raw contact counts fill the vacuum by default, guaranteeing that a 90% CRM dropout rate goes unnoticed and unjudged.
Field marketing and event teams that arm themselves with tools designed to capture leads efficiently and feed data directly into the CRM pipeline are the ones who break this pattern, because the capture-to-CRM handoff is automated rather than hopeful. A concrete example: "Generate 50 qualified leads, director level or above, from pre-identified target accounts, with 100% entered into your CRM before departure" is a SMART goal. "Get as many leads as possible" is a hope. One produces a pass/fail verdict you can defend to a CFO; the other produces a badge-scan count that explains nothing.
Translate Vague Ambitions Into Numeric Targets
Qualified leads, meetings booked, and pipeline influenced are the three numbers that belong in every pre-show objective. Not every trade show has the same job, a product-launch show demands a different ROI definition than a relationship-nurture show, which is exactly why locking your numeric targets to the specific role this show plays in your pipeline is the right starting point, not an afterthought. Locking your definition of qualified leads before the show (ICP-fit title, budget authority, active evaluation window) is what makes your CPL calculation defensible later.
Where technology closes the gap: Mobilo's Teams plan ($4/month per member, billed annually) includes lead capture and management, lead enrichment, unlimited leads and contacts, and 6,000 integrations through Zapier, meaning every qualified conversation captured at the booth can flow directly into your CRM the moment it happens, with enriched contact data already attached. That infrastructure is what transforms a SMART lead target from a planning aspiration into a measurable result. The Teams plan also includes custom lead capture forms, so the qualification criteria you set before the show, title, budget authority, evaluation window, are built directly into the capture flow, not retrofitted in a spreadsheet afterward.
One honest trade-off: setting tighter qualification criteria will reduce raw lead volume. That is the correct outcome, not a failure. A smaller number of genuinely qualified conversations is worth more than a large spreadsheet that sales ignores.
Build Your Target Account Hit List Before You Pack the Booth
Pre-identifying priority accounts before the show is one of the highest-return preparation steps available. Building brand presence at trade shows starts long before the booth goes up, and the exhibitors who arrive with a named account hit list and staff briefed by name and title consistently generate a higher proportion of contacts that survive the post-show handoff and reach active pipeline, compared to teams that treat every badge scan as equivalent. Mobilo's team management layer, included in both the Teams ($4/month) and Business ($5/month) plans, gives event leads the ability to control, lock, and override data fields across every rep's card, so the information captured in each interaction is standardized to the format your CRM expects, regardless of which team member had the conversation.
Combine that with the paper business card scanner (available on every plan, including Pro at $3/month) and your staff can also capture contacts from prospects who hand over traditional cards on the show floor, with no manual re-entry required. The result is a target-account hit list that doesn't just exist on a slide deck, it becomes the active framework that shapes every capture, enrichment, and handoff from first tap to closed pipeline.
Key Metrics to Track During the Show - On-Site Signals That Predict Pipeline
Most measurement frameworks collapse at exactly this point because they track volume instead of quality. Badge scans accumulate, booth visits get logged, and the final report shows impressive foot traffic numbers that bear no relationship to whether pipeline targets were hit. The signal that actually predicts revenue outcomes is qualified conversation rate: the proportion of booth interactions that meet a pre-defined threshold of fit, authority, and expressed need.
A rep who logs many badge scans but zero qualification notes produces leads with near-zero Contact Conversion Gravity; a rep who logs a smaller number of conversations with ICP-matched accounts and booth-side lead scoring produces contacts that can actually survive the journey from handshake to active pipeline entry. Qualified conversation rate measures the percentage of total booth interactions that meet a defined threshold: ICP match confirmed, pain point surfaced, next step agreed, and intent level tagged before the rep moves to the next visitor. That threshold is not arbitrary.
It maps directly to the fields a CRM record needs to stay alive through the handoff sequence. When those fields are empty, the record stalls. When they are populated at the moment of conversation, the record moves.
As research on trade-show lead follow-up consistently shows, the window between on-floor capture and CRM entry is where the majority of otherwise qualified contacts are permanently lost, a cost that compounds across every event in a program's calendar and is rarely small in dollar terms. The practical implication is that booth staffing strategy has to change. Optimizing for scan volume rewards speed; optimizing for qualified conversation rate rewards depth.
Those two objectives pull in opposite directions, and most trade show programs have never explicitly chosen between them. Choosing depth means accepting a lower raw count in exchange for a higher percentage of contacts that reach first meeting. The math almost always favors depth when you trace outcomes back to closed revenue rather than stopping at lead volume.
Capturing this metric in real time requires a tagging system that takes fewer than fifteen seconds per contact, long enough to record what matters, short enough that it does not interrupt the conversation itself. This is where arming field marketing and event teams with tools that capture leads efficiently and feed data directly into the CRM pipeline changes the outcome equation. Mobilo's Teams plan ($4/month per member, billed annually) is built precisely for this operating model: it ships with custom lead capture forms, lead enrichment, and full team data analytics, so every qualification tag a rep applies on the floor travels into the CRM without a manual transcription step.
The platform's team management layer gives marketing ops visibility into which reps are actively networking and converting connections into pipeline, not just who tapped the most cards. A paper form does not solve this, because it creates a transcription step that introduces both delay and error. Trade-show follow-up data makes clear that integrating lead capture directly with CRM tools to streamline pipeline management is not a logistics preference; it is the structural difference between a contact that moves and one that stalls.
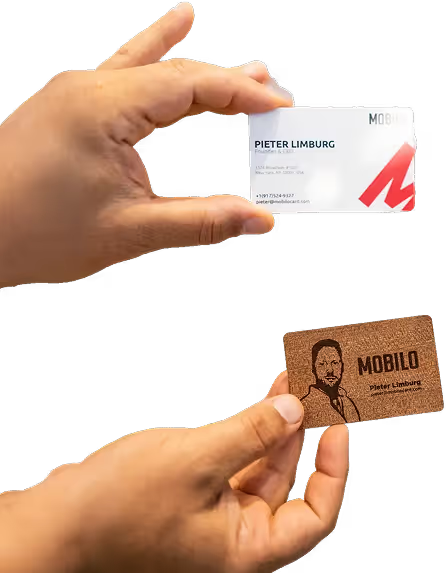
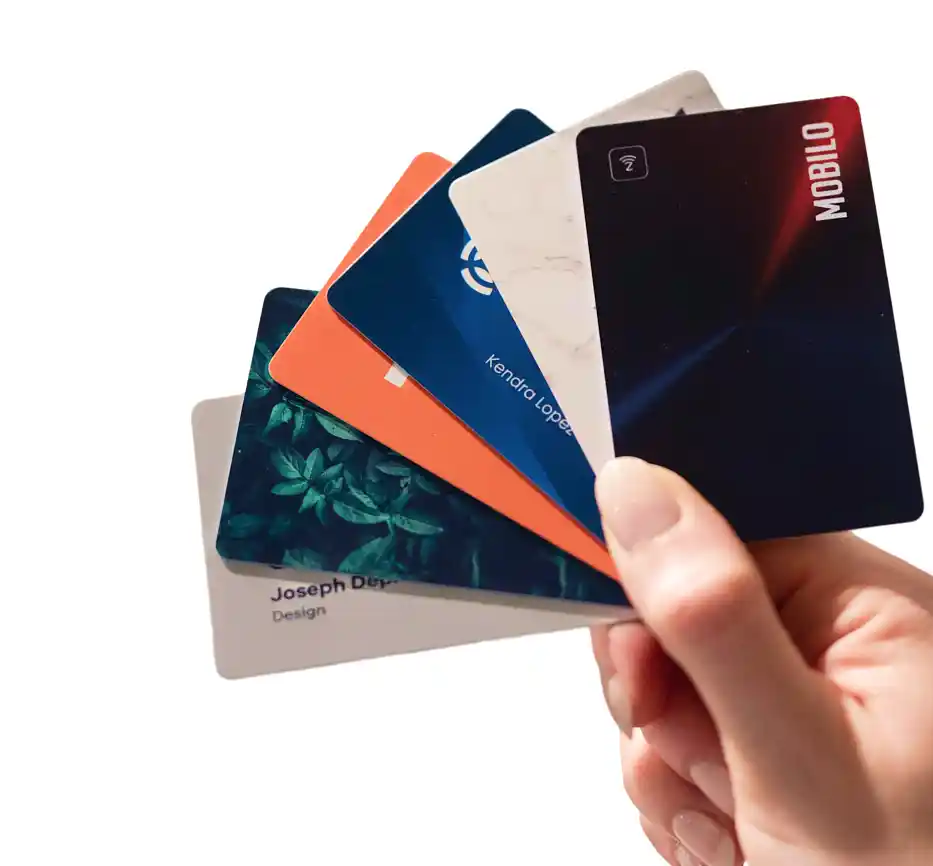
Mobilo's Business plan ($5/month per member, billed annually) extends this further for larger event programs, adding enterprise SSO, HR directory sync, a custom domain, central billing, and white-glove onboarding for teams of 100 or more, features that matter when a single event deploys dozens of reps across multiple booth zones and every qualification signal has to land in one unified pipeline view. For teams running physical card formats alongside digital capture, options range from the Digital Wallet Card ($0 + $4/month on the Teams tier) through Paper Plus, Custom Design, Wood, and Metal NFC cards with QR codes, all supporting unlimited taps and scans and the same full team analytics layer, so the capture method adapts to the environment without sacrificing the data integrity the CRM handoff depends on. KOL partnerships and influencer-led activations at the booth follow the same logic: every interaction, regardless of who initiates it, needs the same qualification tagging to enter the pipeline cleanly.
1. Qualified Lead Scan Rate vs. Raw Badge Scans
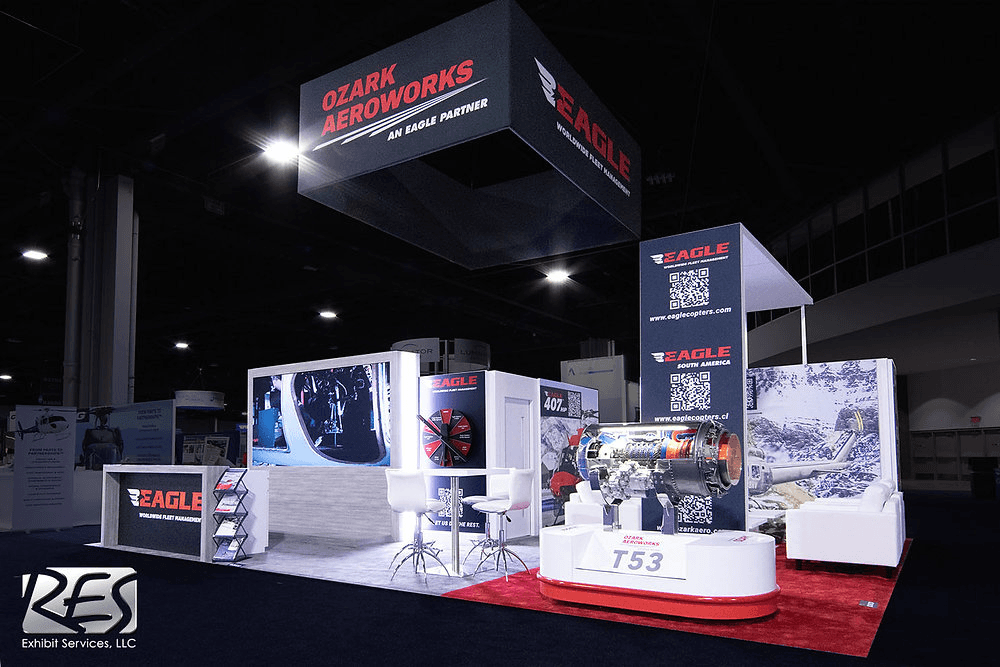
Raw badge scan counts flatter your team without revealing pipeline potential. Tracking the ratio of qualified leads, those tagged with buying intent, budget authority, or a defined timeline, against total scans gives revenue-focused marketers an honest signal of booth conversation quality. The tradeoff: qualification criteria must be defined before the show opens, or reps default to scanning everyone, making the metric meaningless.
2. Average Booth Dwell Time Per Visitor
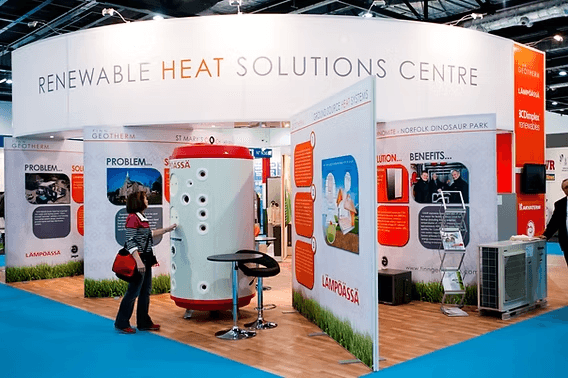
Visitors who linger for three or more minutes are statistically more likely to enter post-show follow-up sequences than those who grab a brochure and walk away. Measuring average dwell time, via footfall sensors, staff tally sheets, or app check-ins, surfaces which demo formats or product stations hold attention longest. The limitation is instrumentation cost: accurate dwell tracking requires hardware or staffing overhead that smaller exhibitors may not budget for.
3. On-Site Meeting Conversion Rate from Pre-Scheduled Appointments
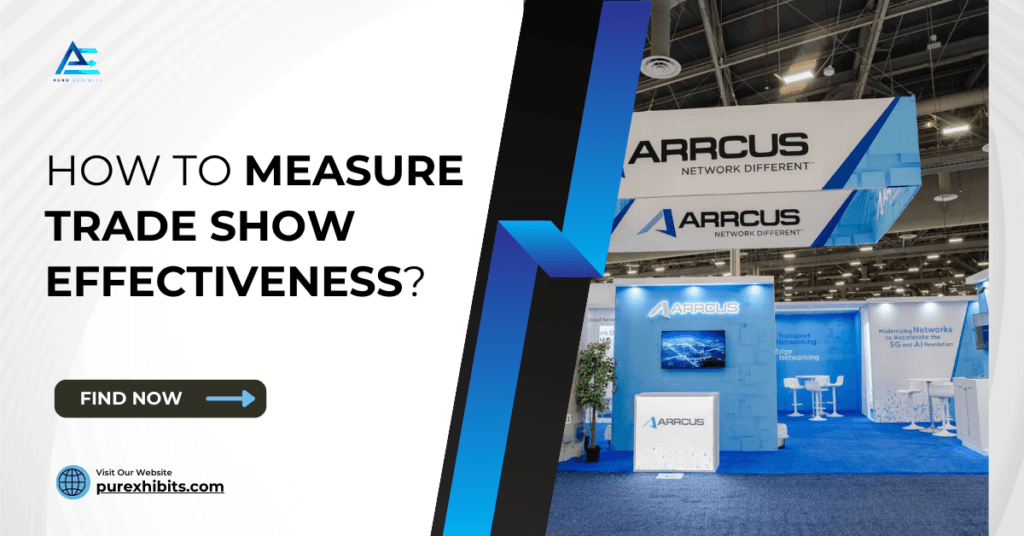
Pre-scheduled meetings that actually happen are among the strongest on-site signals that a prospect is pipeline-ready. Dividing completed appointments by total pre-show bookings reveals both your team's follow-through and the prospect's seriousness. B2B event teams with high appointment-show rates consistently report shorter post-show sales cycles. The key tradeoff: this metric only works if your pre-show outreach generated enough qualified bookings to make the ratio statistically meaningful.
4. Demo Request Depth - Full Demo vs. Overview Requests
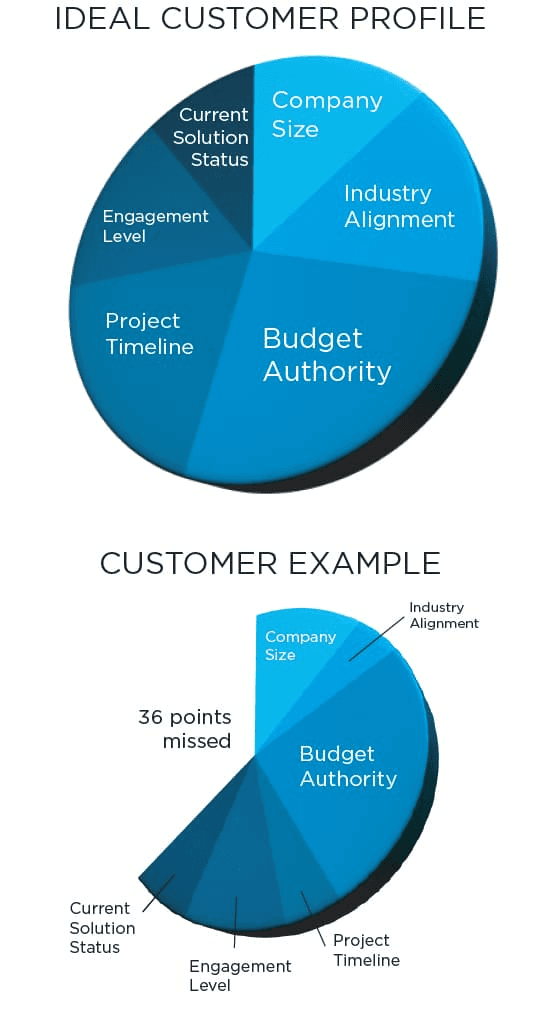
Not all demo requests carry equal weight. Visitors who ask for a full, use-case-specific walkthrough signal far stronger intent than those who accept a generic overview. Segmenting demo requests by depth, tracked in your lead capture app with a simple dropdown, lets sales prioritize follow-up within hours of the show closing. The limitation is rep discipline: without a consistent tagging protocol, the distinction collapses into a single undifferentiated demo count.
5. Competitive Intelligence Mentions Logged Per Conversation
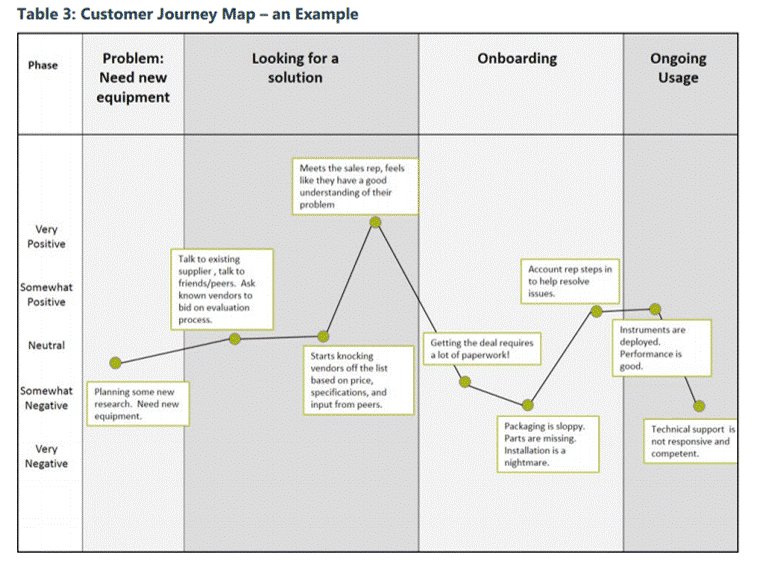
When prospects voluntarily name a competitor during booth conversations, it signals active evaluation, one of the clearest on-site buying signals available. Training reps to log competitive mentions in real time, using a structured note field in your lead capture tool, creates a live map of where your pipeline overlaps with rival booths. The tradeoff: this data is only as reliable as rep note-taking habits under the pressure of a busy show floor.
6. Content Asset Redemption Rate - Gated Collateral Downloads On-Site
Offering gated digital assets, ROI calculators, case study PDFs, or pricing guides, via QR code at the booth creates a measurable engagement layer beyond badge scans. Tracking which assets get downloaded, and by whom, reveals content-level intent and feeds directly into post-show nurture sequencing. For teams measuring how to measure trade show effectiveness, redemption rate ties booth traffic to documented interest. The limitation: low Wi-Fi reliability on show floors can suppress download rates artificially.
Key Metrics to Track After the Show - From Lead List to Pipeline Attribution
Most teams leave a trade show with a lead count and a vague sense of momentum, then discover weeks later that neither translated into pipeline. The metrics that actually reveal show performance sit one layer deeper: qualified lead rate, follow-up response rate by outreach timing, and the conversion rate that connects booth conversations to CRM entries. Getting those numbers right is what separates a defensible ROI from another $18k line item that nobody can explain.
1. Raw Lead Count vs. Qualified Lead Rate - Why Volume Alone Misleads
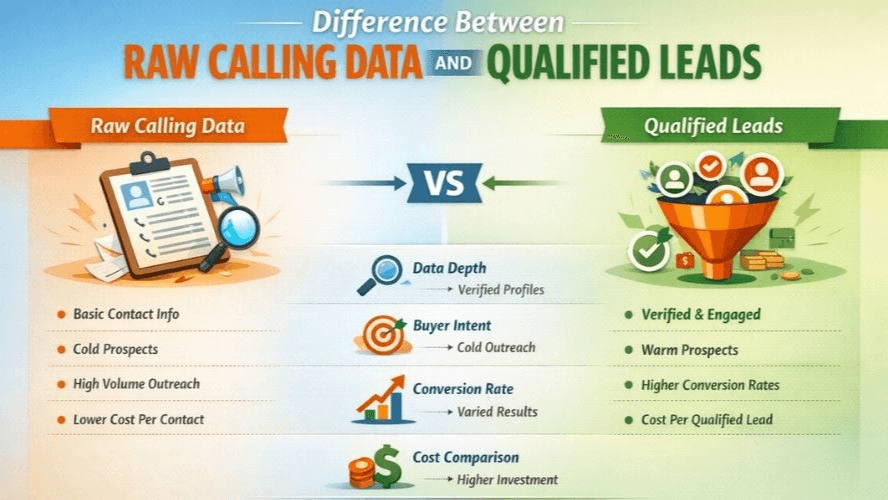
Raw lead count is the metric everyone reports and the one that matters least. According to First Page Sage's channel benchmarks, trade show leads carry a lead-to-MQL conversion rate of approximately 40%, which sounds strong until you realize that rate is measured against a pool already thinned by handoff failure. Teams that track qualified lead rate instead of raw volume catch on-site qualification problems in real time, before a bloated spreadsheet becomes a false sense of pipeline health.
2. Follow-Up Response Rate as a Real-Time Show Health Signal

"Teams return from shows with badge scans and business cards but have no system to track which contacts actually progressed into pipeline, making ROI attribution nearly impossible after three years of spending (~$18k/show)."
Response rate decays faster than most teams expect. What most teams report is a significant drop in reply rates when outreach goes out after the first few days post-show. That window closes while badge-scan CSVs sit in inboxes and reps manually sort notes from paper cards. Tracking response rate by day-of-outreach cohort tells you exactly how much conversion velocity your follow-up process is burning, and gives you the data to justify a faster handoff protocol next time.
3. Lead-to-Pipeline Conversion Rate - Connecting the Booth to the CRM
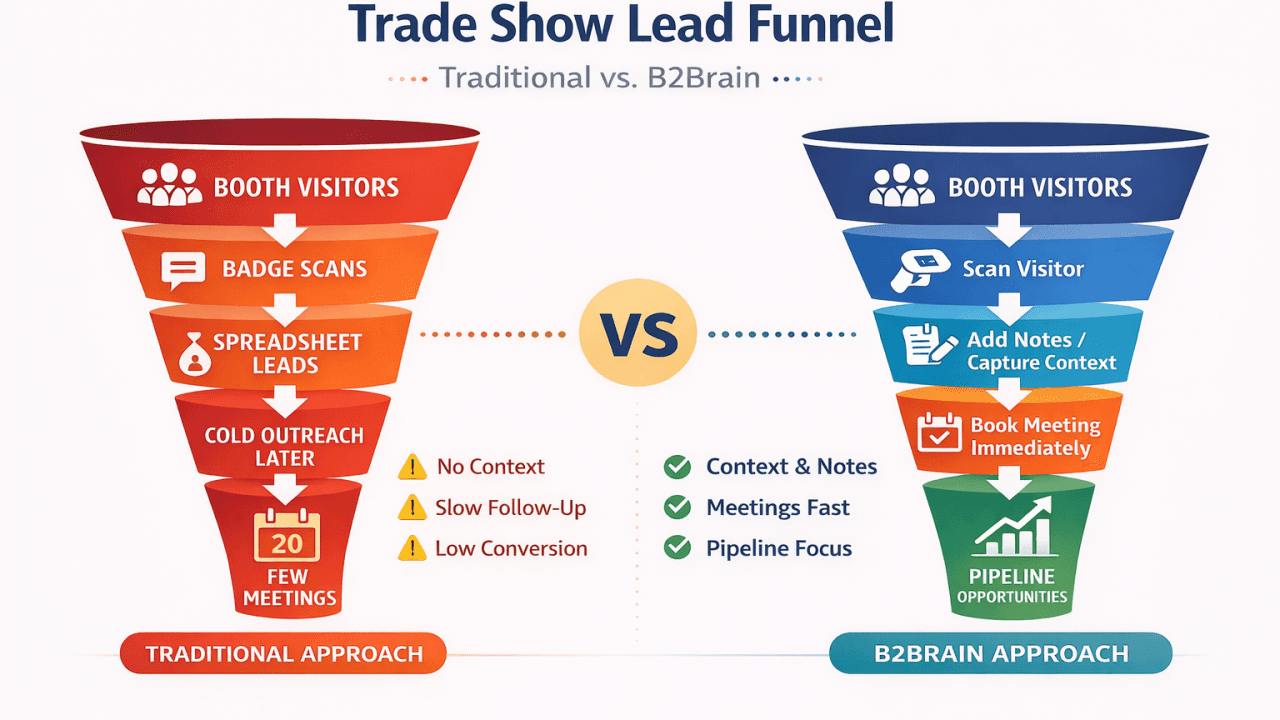
This is the metric that connects booth activity to revenue reality. Measure how many captured contacts progress from lead to CRM opportunity within a defined post-show window, ideally 30 days, and compare that rate against your other acquisition channels. A low conversion rate here almost always traces back to qualification gaps on the floor or handoff delays afterward, not to show quality itself. Teams using a real-time lead capture workflow that syncs contacts directly into the CRM see this rate improve because the lead, the score, and the follow-up trigger are already in place before the team leaves the hall.
4. Cost Per Qualified Lead - The ROI Denominator That Justifies the Budget
Dividing total event spend, booth, travel, sponsorship, staff time, by the number of MQL-qualified leads yields the cost per qualified lead, the single number that lets you compare trade show ROI against digital channels. This metric is essential for CFOs and demand-gen directors defending event budgets. The key limitation is that it requires honest, fully-loaded cost accounting; teams that exclude staff time routinely understate true cost by 30–50%.
5. Lead Segmentation Score - Tiering Your List Before the First Email Goes Out

Applying a structured segmentation score, based on conversation depth, buying authority, and stated timeline, immediately after the show determines which leads receive high-touch outreach versus nurture sequences. For B2B teams with limited SDR capacity, this prioritization directly protects pipeline quality and prevents hot leads from going cold while reps chase unqualified contacts. The tradeoff: scoring is only as reliable as the booth staff's note-taking discipline during the event.
6. Multi-Touch Pipeline Attribution - Crediting the Show Across a Long Sales Cycle
Image: How to Measure Trade Show Effectiveness - multi touch pipeline attribution)
B2B sales cycles can run many months depending on deal size, solution complexity, and buying committee depth, which means a lead generated early in the year may not close until much later. Holding the attribution window open for the full length of your average sales cycle, and tagging every opportunity in the CRM with its originating event, is what allows the show's pipeline contribution to appear in the final ROI calculation rather than being credited to a later touch that happened to fall closer to the close date.
Related Reading
- Etiquette For Networking In Online Conferences
- Measuring Event Roi
- Trade Show Sales Tips
- Trade Show Follow Up Best Practices
- How Do You Find The Roi Of A Trade Show
- Trade Show Sales Funnel
- What Is Trade Show Marketing
- Event Lead Management
- B2b Trade Show Best Practices
- Conference Lead Generation
- B2b Trade Show Marketing
How to Calculate Cost Per Lead and Cost Per Closed Deal - Step by Step
Most teams walk away from a show with a CPL that looks defensible on a slide but falls apart the moment finance asks how the denominator was built. The number is usually inflated by a methodology problem that starts on the show floor: contacts get collected in bulk, qualification gets deferred, and the CRM never sees most of them. What follows is a step-by-step breakdown of how to calculate CPL and cost per closed deal in a way that reflects actual pipeline, starting with why the denominator you choose determines whether the number means anything at all.

Why Total Contacts Produces a CPL That Won't Survive a CFO Review
The core synthesis claim here is this: cost-per-lead (CPL) calculations that use total contacts collected, rather than qualified leads that entered the CRM, produce a number that is mathematically indefensible and strategically dangerous. It gives finance a falsely optimistic CPL that survives budget reviews while hiding the true cost-per-revenue-dollar that would expose which shows actually deserve reinvestment. Using total contacts in the denominator is not a conservative estimate; it is a mathematically indefensible one.
Only a small fraction of contacts collected at trade shows qualify as genuine pipeline-ready leads. That means the typical team is inflating its denominator by a significant multiple, which mechanically deflates CPL by the same factor. That single methodological choice can move the reported number to a small fraction of the true figure, a number that looks like a win in a post-show deck but cannot withstand the scrutiny of a serious budget review.
The downstream consequences compound quickly, and they trace back to a problem that is almost always structural rather than strategic: reps at events have no reliable, friction-free mechanism to qualify and route contacts into the CRM in real time. When the capture process depends on manual badge scanning, business card hand-keying, or post-show spreadsheet cleanup, the natural incentive is to collect volume first and sort later, which means "later" often never happens. A CPL built on that process rewards the wrong behavior: it incentivizes volume collection over qualification, encourages teams to staff booths with scanners rather than salespeople, and produces benchmarks that are impossible to compare across events because every team is measuring something different.
When finance uses that same figure to model next year's event budget, they are building a forecast on a denominator that includes hundreds of contacts who will never enter the CRM, never receive a follow-up call, and never generate revenue. Teams that attend events regularly and need structured lead follow-up feel this acutely; the gap between contacts collected and contacts that actually move through the pipeline is where event ROI quietly disappears. This is precisely the failure mode that direct-to-CRM capture is designed to close.
Mobilo's lead capture and management toolset, available on every subscription tier starting at $3/month on the Pro plan and $4/month on the Teams plan (billed annually), routes leads captured from events and field meetings directly into the CRM without relying on reps to manually log contacts after the fact. The Teams and Business plans layer on full team data analytics, custom lead capture forms, lead enrichment, and centralized billing, so every contact captured on the floor carries a structured, enrichable record by the time it reaches the pipeline. The Business plan ($5/month, billed annually) adds enterprise SSO, HR directory sync, and 24/7 customer support, giving larger organizations the controls finance needs to audit the denominator with confidence.
All plans connect to 6,000 integrations through Zapier, meaning the path from tap to CRM record can be fully automated with no manual intervention. What most teams report bears this out: the large majority of contacts captured at trade shows through manual methods never advance to a CRM-qualified pipeline record, meaning the real cost-per-qualified-lead is often several multiples higher than the figure built on total badge-scan counts, a gap that widens further when qualification criteria are applied consistently. That gap is not a rounding error; it is the difference between a program that looks profitable and one that is quietly destroying budget that could be reallocated to higher-performing channels.
B2B cost-per-lead benchmarks confirm that fully loaded CPL figures for qualified trade show leads land well above what most post-show decks report, and industry research reinforces that teams working with a total-contacts denominator are not outperforming the market, they are measuring a different, and far less meaningful, number. The metric that closes this gap is cost per closed deal (CPCD). It is the only figure that connects the full event investment, booth fees, travel, staff time, collateral, logistics, to an outcome a CFO can act on.
Teams that show a figure far below published benchmarks are almost always working with a different denominator: total contacts rather than qualified leads. The benchmark gap is not evidence of superior efficiency; it is evidence that the methodologies are not comparable, and that the lower figure will not hold up when finance asks how many of those contacts became closed revenue. Eliminating the gap starts by eliminating the manual step that lets unqualified contacts pollute the denominator in the first place, capturing and following up on leads more efficiently at networking events and in the field, with every record flowing directly into the pipeline from the moment of first contact.
How to Calculate Trade Show ROI - Formula, Example, and What the Number Actually Tells You
A trade show where attributed revenue substantially exceeds total investment delivers a strong ROI. That same show, where manual badge scans cause most contacts to decay before they reach the CRM, returns a fraction of that figure. Same event. Same booth. Entirely different number. The formula is straightforward; what corrupts it is the data feeding into it.
Revenue Attribution Across a Long B2B Sales Cycle
Revenue attribution is where the formula gets honest. B2B sales cycles sourced from events frequently run many months, which means a show early in the year may not close revenue until much later. The practical fix is to hold the attribution window open for the length of your average sales cycle, tag every opportunity in the CRM with the originating event, and credit only deals where the show was the first qualified touchpoint. Avoid double-counting deals that were already in pipeline before the event. Partial attribution models, where the show receives a weighted share alongside later touches, are more defensible to a CFO than a binary first-touch claim.
Using the ROI Number as a Budget-Defense Instrument, Not a Report Card
The real power of the formula is forward-looking. Work the formula in reverse: set a target ROI, plug in your projected total investment, and solve for the minimum revenue required. Then divide that revenue figure by your average deal size to get the minimum closed deals needed, and divide that by your historical close rate to get the minimum qualified leads the booth must generate. That number becomes your pre-show target, not a post-show excuse.
Related Reading
- Which Networking Software Is Best For Conferences
- Trade Show Booth Ideas To Attract Visitors
- Conference Lead Capture
- Virtual Event Success Metrics
- Trade Show Roi
- Trade Show Lead Generation Ideas
- What's The Best Event Lead Generation Software
- Post-Trade Show Marketing Strategies
- Best Trade Show Giveaways
The Hidden ROI Gap - What Real Enterprise Teams Save When the Lead Capture Layer Is Digital
Manual capture doesn't just lose leads, it loses the data those leads would have generated, and that loss compounds before the first post-show report is ever opened. Paper cards that never reach the CRM represent not just missing contacts but missing attribution, missing pipeline stages, and missing dollar figures that no retrospective audit can fully recover. That is the gap most post-show measurement frameworks never reach, because they start at the CRM and work backward, not at the moment of contact on the show floor.

The Hidden Cost of Manual Card Collection
The print cost alone is quantifiable and large. Landsea Homes eliminated $21,000 per year in print spend after replacing their card stack with Mobilo NFC and QR digital business cards. The Falcon Group documented $6,000 per year in savings on the same switch.
These are not projections; they are named, published outcomes from enterprise teams that ran the numbers. You can read the Landsea Homes case study directly. For a sizable field team ordering cards in bulk, reprinting for title changes, and restocking after every major event cycle, annual print spend in that range is ordinary, not exceptional. Critically, those teams did not require IT involvement to get there.
Mobilo's card deployment is designed so that a team admin, not a dev team, can set up and deploy digital business cards across an entire sales team quickly and without IT headaches. The Teams plan ($4/month per member, billed annually) supports unlimited team members from day one, with team management, central billing, and the ability to control, lock, and override data fields across every card in the account. A design team handling branding assets can apply custom QR codes and personalized business card templates at scale; individual card holders simply tap or scan.
At a Glance
Choose the NFC card based on your preferred material and budget—all three options include unlimited usage and full team analytics:
- Custom-designed NFC card with QR code – $29.50 (originally $39.00) → Unlimited taps/scans + full team data analytics.
- Wood NFC card with QR code – $39.50 → Unlimited taps/scans + full team data analytics.
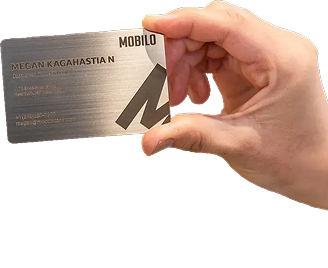
- Metal NFC card with QR code – $69.50 → Unlimited taps/scans + full team data analytics.
The honest trade-off: Mobilo's contact exchange and lead capture layer is most beneficial when a team attends events regularly and needs structured lead follow-up. If your team rarely meets prospects in person, the print savings alone may not justify a full rollout. The ROI case strengthens significantly for teams attending three or more events per year.
Where the Handoff Breaks, The Contact Loss Window Between Booth and CRM
The print cost is the entry fee. The larger loss happens after the cards are exchanged. Across the market, the majority of contacts captured at trade shows through manual methods never reach a CRM record with enough detail to trigger a follow-up sequence. Cards get pocketed, stacked, and forgotten. Manual entry backlogs build up on the flight home. By the time a rep opens the CRM on Monday, the follow-up window that research links to higher conversion rates has already closed.
Speed to lead is not a soft metric. What most teams report from post-event follow-up consistently shows that outreach initiated quickly after an event produces meaningfully higher response and conversion rates than outreach that is delayed, a pattern that makes every hour of data-entry lag a direct cost to pipeline velocity, not just an operational inconvenience. Both the Teams and Business plans include lead enrichment, custom lead capture forms, lead capture and management, and unlimited leads and contacts, meaning every contact captured on the show floor enters a structured pipeline immediately, with no manual re-keying required.
The Mobilo digital business card app also includes a paper business card scanner, so even contacts who hand over a traditional card don't fall out of the capture flow.
Attribution Data Your CRM Actually Needs
The savings figures from Landsea Homes and Falcon matter, but they are not the primary ROI argument. They fund the system. The primary return is what Mobilo's centrally managed lead capture layer delivers after the event: every contact that was tapped or scanned on the show floor arrives in the CRM with a timestamp, a qualification tag, and a follow-up trigger already in place, so the attribution data your marketing ops team needs to calculate true pipeline ROI exists from day one, rather than having to be reconstructed from a stack of paper cards that made it back to the office.
That pipeline visibility is reinforced by the platform's insights and analytics, which are included on every plan tier, and by integrations available through Zapier, covering the CRM, marketing automation, and sales sequencing tools most enterprise ops stacks already run. For organizations that need deeper controls, the Business plan ($5/month per member, billed annually) adds enterprise SSO, HR directory sync, a custom domain, and white-glove onboarding. The result is a lead capture infrastructure that a team admin can deploy without IT, that individual card holders can operate with a single tap, and that marketing ops can interrogate from day one, because the data was never paper to begin with.
Related Reading
- Best Tech Conferences For Networking
- Best Networking Apps for Trade Show Attendees
- Best Finance Conferences For Networking
- Trade Show Booth Ideas For Small Budgets
- Virtual Conference Booth Ideas
- Networking Activity Ideas For Conferences
- What Are The Top Trade Show Lead Retrieval Tools
- Trade Show Follow Up Email Examples
- Conference Lead Capture Tools
- Trade Show Lead Capture App
Next steps
If your $150K event keeps producing flat pipeline numbers despite a full booth of badge scans, the path forward starts with accepting that qualified leads entering the CRM within 48 hours is the only metric that tells the truth about what the show actually produced. Start with our digital business card.
Pre-show objective-setting is the only mechanism that prevents badge-scan volume from becoming the default success metric by accident, which means skipping it guarantees a 90% CRM dropout rate goes unnoticed and unjudged. Cost-per-lead calculations built on total contacts rather than CRM-qualified leads produce a number that is mathematically indefensible, which means your CFO is approving next year's event budget against a denominator inflated by contacts that will never generate revenue. Together, they point to one corrective action: close the capture gap before the flight home, not after the post-show report lands.
Start with a digital business card that syncs every on-floor conversation directly into your CRM, timestamped and enriched, with no manual re-entry required. Every contact that taps or scans enters the pipeline with qualification context already attached, so the 90-day attribution window starts with clean data instead of a decayed badge-scan CSV.
Frequently Asked Questions
Why is lead count alone a misleading way to measure trade show success?
Badge scan counts record presence, not intent, and 90% of new contacts captured at trade shows never make it into the pipeline because the handoff process is manual and leaky. That means every downstream metric, from cost-per-lead to pipeline attribution, is built on an incomplete dataset. A large contact list that never reaches the CRM is a capture problem disguised as a reporting problem, not a sign of a successful show.
What's the difference between qualified booth traffic and raw foot traffic?
Foot traffic counts every visitor who passes through or stops at the booth, while qualified booth traffic measures only the interactions where ICP fit was confirmed, a pain point was surfaced, a next step was agreed, and an intent level was tagged. The post calls this the qualified conversation rate, and it is the on-site metric that actually predicts whether contacts will survive the handoff into the CRM and reach active pipeline.
How long should I keep the pipeline attribution window open after a trade show?
You should hold the attribution window open for the full length of your average sales cycle, because B2B sales cycles can run many months depending on deal size, solution complexity, and buying committee depth. Tagging every opportunity in the CRM with its originating event is what allows the show's pipeline contribution to appear in the final ROI calculation rather than being credited to a later touch that happened to fall closer to the close date.
How quickly do follow-up response rates drop after the show ends?
Response rates decay faster than most teams expect, with a significant drop when outreach goes out after the first few days post-show. That window closes while badge-scan CSVs sit in inboxes and reps manually sort notes from paper cards. Tracking response rate by day-of-outreach cohort shows exactly how much conversion velocity the follow-up process is burning.
What should I actually set as a trade show goal before the event?
Your goal should be a SMART target tied to a specific number, for example, "Generate 50 qualified leads, director level or above, from pre-identified target accounts, with 100% entered into your CRM before departure." The post explains that pre-show objective-setting is the only mechanism that prevents badge-scan volume from becoming the default success metric by accident, because teams that skip it have no alternative measurement framework to fall back on.